Microsoft Excel has become a go-to tool across industries for managing and analyzing data. Whether it's budgeting, record-keeping, or tracking progress, Excel provides a structured platform to work with numbers and text efficiently. While it might seem complex at first glance, learning the basics is all it takes to start using it confidently for everyday tasks.
Familiarizing Yourself with Excel’s Workspace
When you open Excel, you're met with a grid composed of rows and columns. These intersecting cells serve as containers for your data. At the top, the ribbon houses grouped commands under tabs like Home, Insert, and Formulas. You’ll find the formula bar just beneath the ribbon, which displays the content or formula in a selected cell. Below the worksheet are sheet tabs, which allow you to organize your work across multiple pages within the same file. Boost your data management skills with our Microsoft Excel Online Training designed for beginners and professionals alike.
How to Input and Handle Data in Excel
Excel allows for simple data entry. Just click a cell and begin typing — whether it’s text, numbers, or dates. Navigation is smooth with the Tab or Enter keys to move horizontally or vertically. If you want to change an entry, double-click the cell or use the formula bar. You can also use features like AutoFill, which completes series automatically such as consecutive numbers or days of the week, helping reduce repetitive work.
Essential Formatting Tips to Improve Your Sheets
A well-organized spreadsheet is easier to read and understand. Here are some formatting tips for beginners:
- Bold or highlight column headers to distinguish them from the data below
- Add borders around tables for a cleaner layout
- Align text and numbers properly for a polished appearance
- Use number formatting to show data as currency, percentage, or dates
- Apply background colors or shading to emphasize key values
These small changes greatly improve the clarity and presentation of your Excel sheets.
Using Basic Formulas and Functions
Excel shines when it comes to calculations. You can create simple formulas starting with an equal sign, followed by a combination of numbers or cell references. For example, typing =A1+A2 adds the values in those two cells. There are also ready-made functions like SUM, AVERAGE, COUNT, and MAX that handle common tasks easily. These tools help you draw insights from your data quickly and accurately, even when working with large volumes of information.
Creating Charts to Represent Data Visually
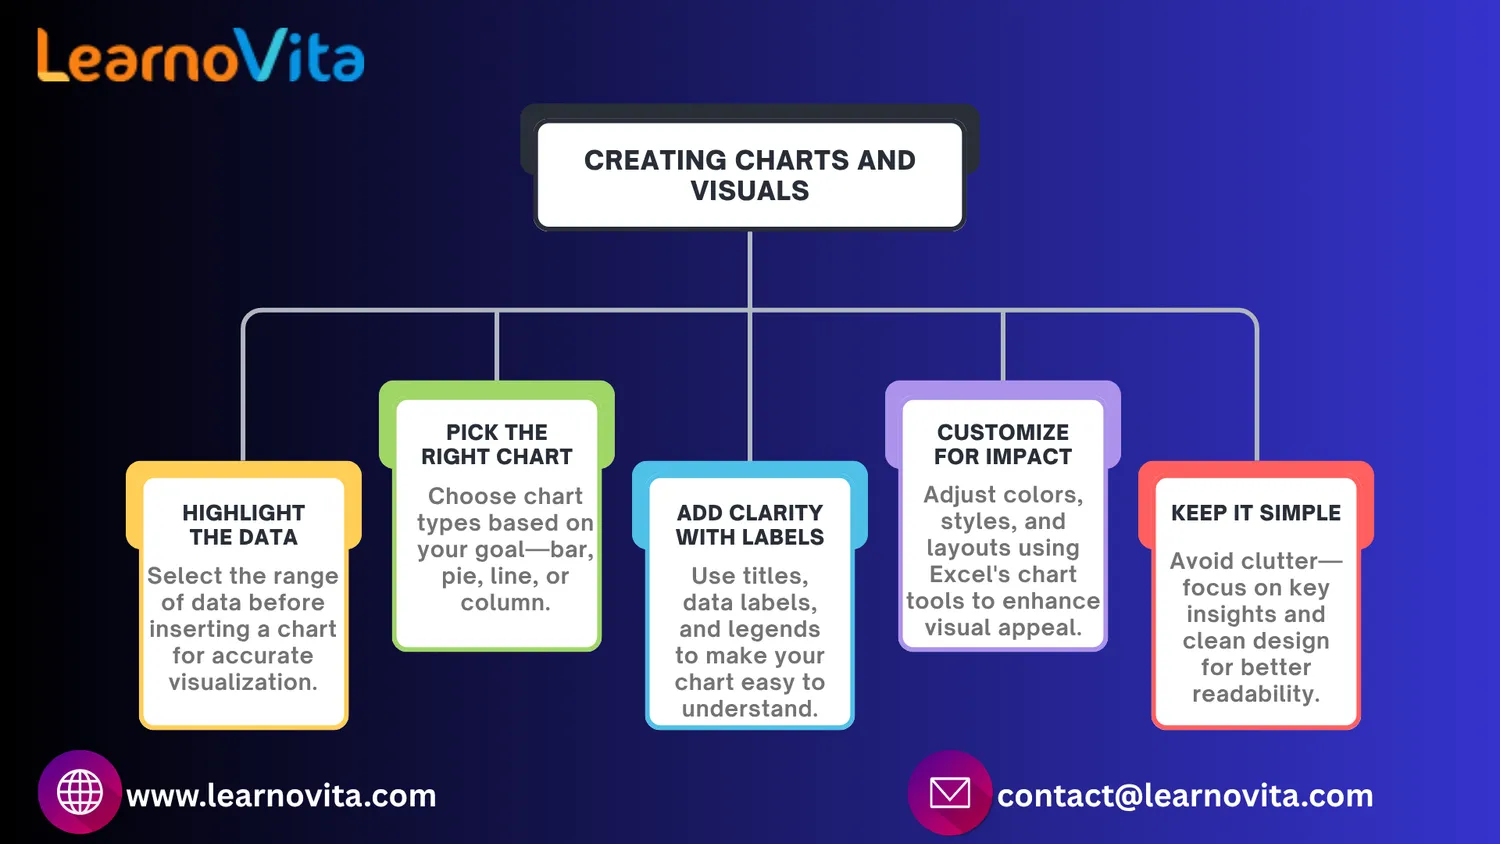
A great way to make your data more meaningful is to visualize it. Excel allows you to build charts such as bar, line, and pie charts with just a few clicks. After selecting your data, go to the Insert tab and choose the chart type that fits your needs. You can then fine-tune it by editing colors, adding titles, or adjusting labels. Visuals like these help convey trends and comparisons in an intuitive way, especially useful when sharing data with others. Enroll in the Best Online Training & Placement Program to gain in-demand skills and secure top career opportunities with expert guidance.
Practical Ways Beginners Can Use Excel
Even at a beginner level, Excel is incredibly useful in daily life. Here are some common ways to put it to work:
- Track personal spending and monthly budgets
- Organize to-do lists for home, school, or work
- Maintain inventory records with item names and quantities
- Plan a study timetable or assignment deadlines
- Keep attendance logs for meetings or classes
These simple applications show how versatile Excel is, even with basic skills.
Saving and Sharing Your Workbooks
Once your spreadsheet is ready, saving it is simple. Excel supports multiple formats like .xlsx for editable files, .csv for plain data, and .pdf for easy sharing. You can save your work locally or upload it to cloud storage like OneDrive, giving you access across devices. Sharing is easy too; you can collaborate with others by granting editing or view-only permissions, making teamwork more seamless.
Conclusion
Starting with Excel is more about practice than perfection. Once you learn how to move around the interface, enter and format your data, use basic formulas, and visualize results with charts, you’ll start to see its real value. It’s not just a tool for numbers, it's a versatile platform that helps you stay organized, efficient, and informed. With time and regular use, what begins as a learning curve becomes an essential skill you can use anywhere.