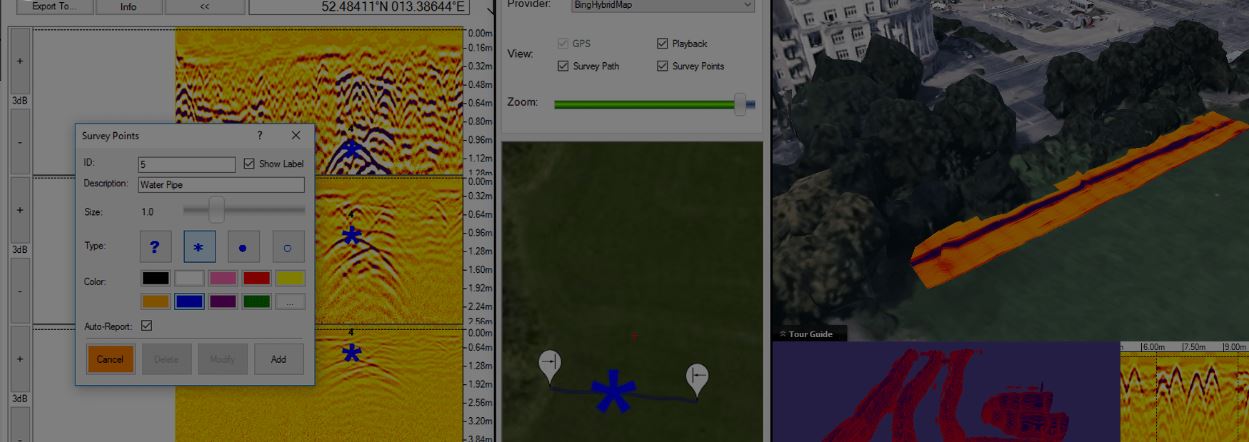
Ground Penetrating Radar (GPR) has become a cornerstone technology for non-destructive subsurface investigations. From construction and utility detection to archaeology and geology, GPR offers a way to "see" beneath the ground without excavation. However, the real power of GPR lies not just in data collection but in how that data is analyzed and interpreted.
GPR data analysis involves processing reflected radar signals to reveal hidden features beneath surfaces such as soil, rock, concrete, or asphalt. The process requires a blend of geophysical knowledge, signal processing skills, and software expertise.
The Fundamentals of GPR Data
When a GPR system transmits electromagnetic pulses into the ground, those waves reflect back whenever they encounter materials with different dielectric properties. Each reflection represents a change in subsurface composition—such as soil to rock, air voids, or buried metal objects.
The GPR unit records the strength and time of these reflections, creating radargrams or profile images. Analysts then study these radargrams to infer the location, shape, and depth of subsurface features.
Key data outputs include:
- Amplitude: Signal strength, which helps identify material contrasts.
- Two-way Travel Time: The time it takes for radar waves to travel down and reflect back.
- Depth Conversion: Estimating depth based on known or measured signal velocity.
Steps in GPR Data Analysis
1. Data Collection and Calibration
Accurate analysis begins in the field. Operators must ensure proper antenna frequency selection, surface coupling, and consistent scanning speed. Calibration tests—often done on known reference areas—help determine radar velocity in local materials, crucial for depth accuracy.
2. Pre-Processing
Before interpretation, raw GPR data undergoes pre-processing to remove noise and enhance clarity. Common steps include:
- Time-zero correction: Aligning signals to account for antenna delays.
- Background removal: Eliminating repetitive noise from surface reflections.
- Gain adjustment: Amplifying deeper signals for better visibility.
- Filtering: Removing unwanted frequencies or interference.
3. Migration
Migration corrects hyperbolic reflections caused by point targets. By repositioning reflections to their true subsurface locations, migration creates a clearer and more accurate image of buried features.
4. Amplitude and Attribute Analysis
Amplitude variations often reveal changes in material density, moisture, or composition. Analysts may use amplitude maps, frequency spectra, or envelope detection to highlight anomalies.
5. Depth Conversion and 3D Visualization
Once radar velocities are known, time-domain data can be converted into depth profiles. In complex surveys, multiple GPR lines are combined to produce 3D subsurface models—useful for mapping utilities, rebar grids, or geological layers.
6. Interpretation
Interpretation combines signal patterns, field context, and cross-validation with other data sources. Experienced analysts identify features such as pipes, voids, cracks, or soil boundaries. Proper labeling and correlation with ground truth data ensure reliable conclusions.
Software and Analytical Tools
Modern GPR data analysis relies heavily on specialized software. These platforms offer features such as 3D modeling, real-time signal processing, and automated feature detection. Common tools enable analysts to apply filters, measure reflection intensities, and visualize layers through time-slice mapping.
Advanced analysis may include:
- Frequency analysis for differentiating between material types.
- Attribute mapping to locate anomalies.
- Machine learning algorithms that classify subsurface objects automatically.
Common Challenges in GPR Data Analysis
While GPR is powerful, interpreting radar data can be complex due to:
- Signal Attenuation: Highly conductive materials like clay or saltwater can weaken radar signals, reducing penetration depth.
- Clutter and Noise: Overlapping reflections can obscure target signatures.
- Velocity Uncertainty: Incorrect velocity estimates lead to inaccurate depth calculations.
- Human Interpretation Bias: Inexperienced analysts may misidentify natural features as man-made structures.
To overcome these challenges, analysts often combine GPR results with other geophysical methods—such as electromagnetic induction or resistivity surveys—for confirmation.
Applications of GPR Data Analysis
1. Construction and Civil Engineering
GPR helps locate rebar, post-tension cables, and voids within concrete structures. It also assists in mapping underground utilities before excavation, reducing the risk of costly damage.
2. Geotechnical and Environmental Studies
In geotechnical projects, GPR identifies soil stratigraphy, groundwater levels, and bedrock depth. Environmental scientists use it to detect contamination plumes or buried waste materials.
3. Archaeology and Cultural Heritage
Archaeologists use GPR to uncover buried walls, graves, and artifacts without disturbing the ground. Data analysis reveals patterns consistent with historical structures or settlements.
4. Transportation Infrastructure
GPR surveys are critical for assessing pavement thickness, detecting subsurface voids, and evaluating bridge decks. Analysis helps maintenance teams prioritize repairs and ensure safety.
5. Mining and Geological Exploration
In mineral exploration, GPR data helps locate fractures, cavities, or changes in rock composition. It complements core sampling and seismic studies for a more complete geological understanding.
Best Practices for Reliable GPR Analysis
- Use the Right Frequency: Lower frequencies penetrate deeper but produce lower resolution, while higher frequencies offer detailed imaging at shallow depths.
- Maintain Accurate Positioning: GPS or grid-based mapping ensures that results align with physical coordinates.
- Validate with Ground Truthing: Core drilling or direct observation confirms GPR interpretations.
- Document Parameters: Recording antenna type, frequency, and environmental conditions ensures reproducibility.
- Continuous Training: Analysts should update skills as software and signal-processing methods evolve.
The Future of GPR Data Analysis
The field of GPR data analysis is advancing rapidly with the integration of artificial intelligence and 3D visualization. AI-driven interpretation reduces subjectivity and speeds up data processing. Cloud-based platforms now allow teams to collaborate on large datasets remotely.
Furthermore, combining GPR with other sensors—like LiDAR or photogrammetry—creates comprehensive digital twins of subsurface environments. These advancements are transforming industries from construction to environmental science, offering greater accuracy and efficiency than ever before.
Conclusion
GPR data analysis bridges the gap between radar technology and actionable insights. By carefully processing and interpreting reflected signals, professionals can map underground structures, assess material conditions, and mitigate risks across diverse industries.
In Dayton, New Jersey or anywhere in the world, successful GPR analysis depends on three pillars: data quality, technical expertise, and thoughtful interpretation. As analytical tools evolve, the ability to visualize and understand what lies beneath the surface will continue to improve—making GPR an indispensable asset for modern infrastructure, research, and exploration.