Introduction
Imagine being the person every company relies on to uncover why sales dropped last quarter or which customers will return next month. That’s the power of data analytics. If you’ve been exploring Data analyst online classes you’re likely wondering what skills will I actually learn?
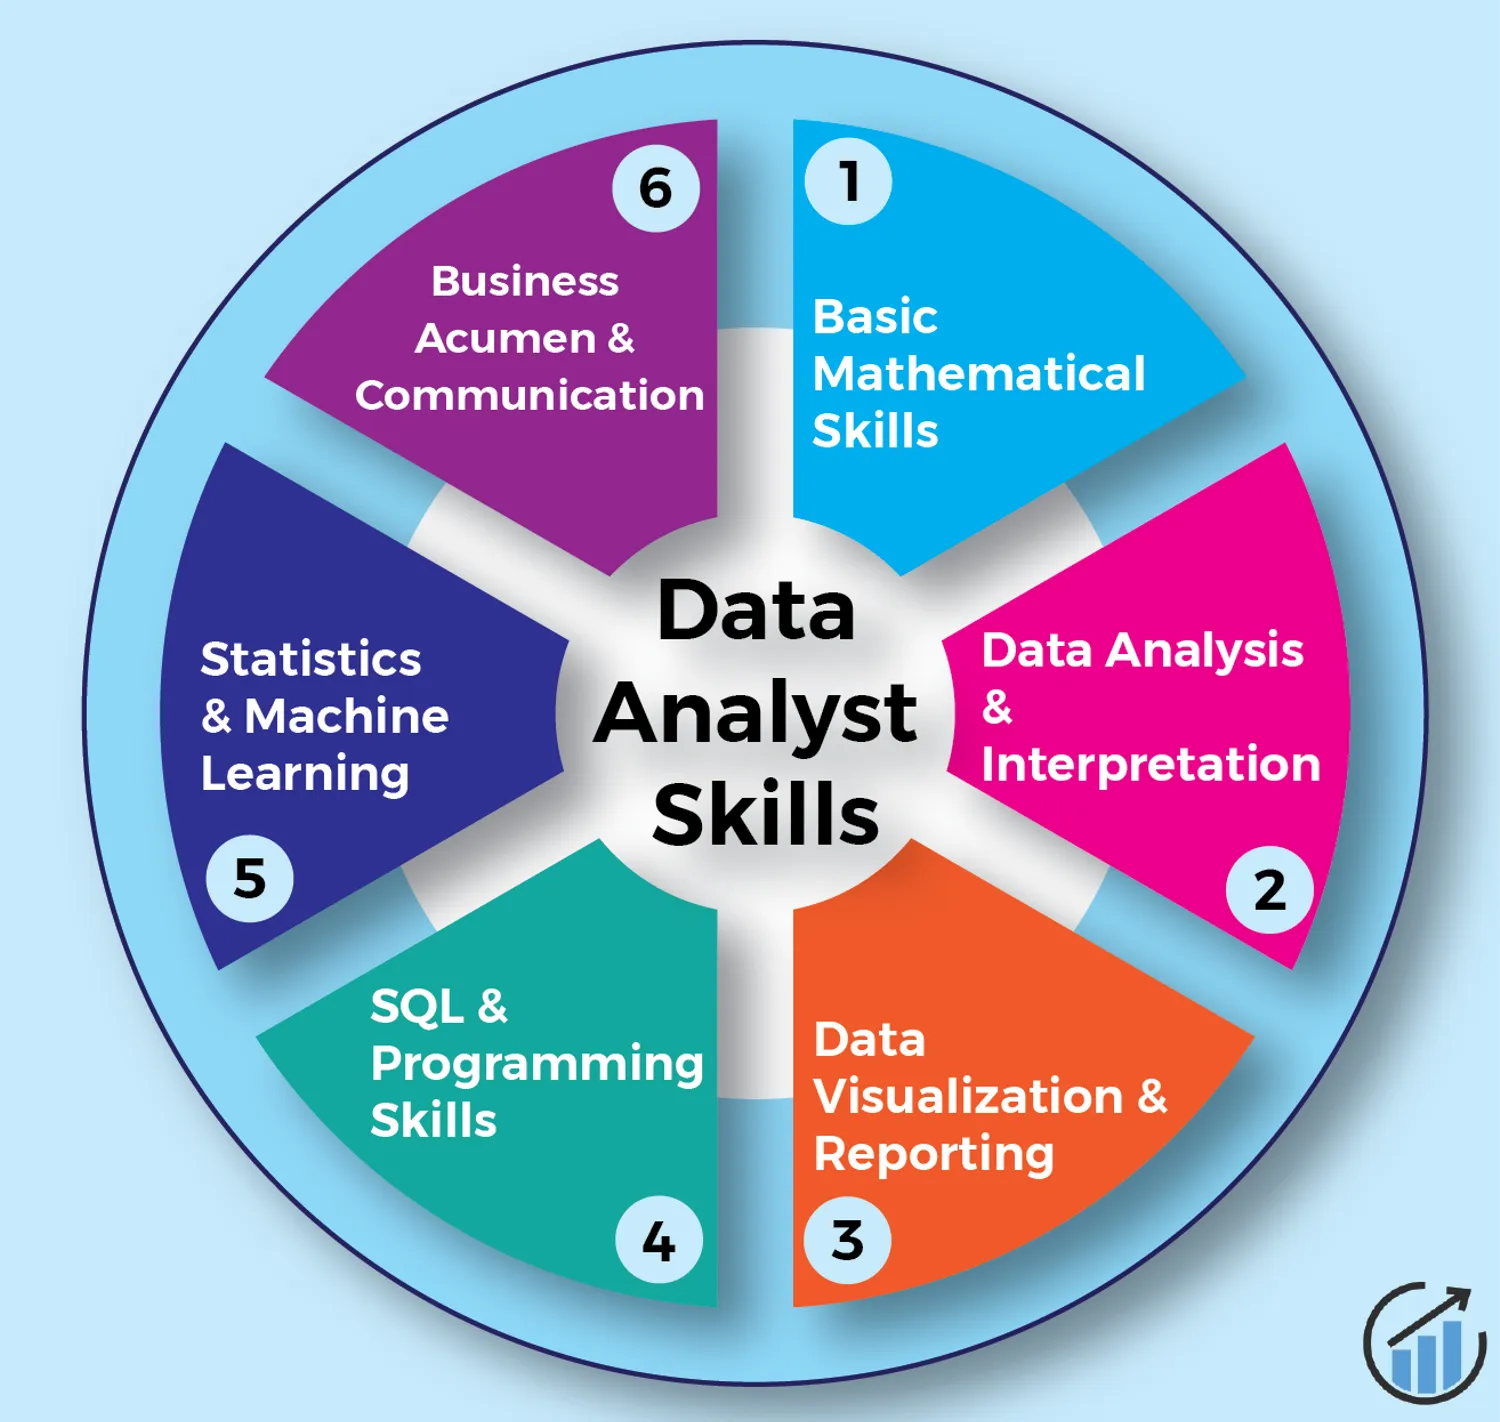
A Data Analytics certification is designed to teach you how to transform raw data into meaningful insights. You’ll learn technical skills, business problem-solving, and data storytelling skills that help companies make smarter decisions. Let’s explore each area in depth and see how a data analytics bootcamp or course prepares you for a career in this exciting field.
1. Understanding Data and Problem Framing
Before you analyze data, you must know how to frame the right questions. Every Data Analytics course begins by teaching you how to define business problems in measurable ways.
For example, imagine you’re asked why a company’s customer satisfaction score dropped. You’ll learn to turn that vague question into specific, data-driven queries such as:
- Did customer support wait times increase?
- Did delivery times slow down?
- Did website downtime affect orders?
In a Data Analytics certification, you’ll learn the concept of data literacy understanding how data is collected, structured, and used. You’ll also practice identifying the right datasets to answer business questions. This skill is crucial for any analyst, as it ensures that you focus on the data that truly matters.
2. Data Collection, Cleaning, and Preparation
Data is rarely perfect. It’s often messy, incomplete, or inconsistent. That’s why a large part of any Data Analytics course online focuses on data cleaning and preparation.
You’ll learn how to:
- Handle missing values and duplicates.
- Standardize data formats.
- Merge multiple data sources.
- Transform raw data into structured tables for analysis.
For example, if you’re working with customer purchase data, you might remove duplicate entries, fix inconsistent date formats, and fill in missing values for product categories. These skills make your data reliable, which ensures accurate analysis.
Most employers say that data cleaning is one of the most time-consuming parts of a data analyst’s job, so mastering it gives you an immediate professional edge.
3. Mastering Core Technical Tools: Excel, SQL, and Python
Every analyst uses tools to explore and manage data. A Google data analytics certification will train you in the three most common:
Excel or Google Sheets
You’ll move beyond simple formulas to advanced analytics using PivotTables, lookup functions, and dashboard creation. You’ll learn how to manipulate data quickly and summarize information visually.
SQL
SQL (Structured Query Language) is the foundation of database work. You’ll learn how to:
- Extract data using SELECT statements.
- Combine tables with JOIN.
- Summarize data using GROUP BY.
- Apply filters and conditions with WHERE clauses.
For instance, you might write a query to find the top-selling products by region or to calculate monthly revenue growth.
Python (or R)
For more advanced analytics, you’ll learn programming languages such as Python. You’ll use libraries like pandas for data manipulation and matplotlib for visualization.
Example snippet:
import pandas as pd
import matplotlib.pyplot as plt
data = pd.read_csv("sales.csv")
data.groupby("region")["revenue"].sum().plot(kind="bar")
plt.title("Revenue by Region")
plt.show()
This simple code block aggregates revenue by region and presents it visually as a core task in everyday analytics work.
4. Exploratory Data Analysis (EDA) and Statistics
Once your data is clean, the next step is to explore it. This is where exploratory data analysis (EDA) comes in. You’ll learn to identify trends, detect patterns, and uncover outliers using statistical methods.
Key concepts include:
- Measures of central tendency (mean, median, mode).
- Variance and standard deviation.
- Correlation and regression.
- Hypothesis testing and significance levels.
Example: You might analyze a dataset of marketing campaigns and discover that email campaigns have a higher conversion rate than social media ads. You’ll then test whether the difference is statistically significant or due to random variation.
A solid understanding of statistics allows you to make data-backed conclusions instead of relying on guesswork.
5. Data Visualization and Storytelling
Numbers mean little without context. That’s why every Data Analytics course online teaches data visualization and storytelling. You’ll learn how to present findings visually so decision-makers can quickly understand them.
You’ll create dashboards and charts using:
- Excel and Google Sheets.
- Tableau or Power BI.
- Python visualization libraries (Matplotlib, Seaborn).
For example, you could visualize monthly sales trends across regions and highlight which areas contribute most to revenue. The goal isn’t just to display data, it's to tell a story that leads to an action.
A good data analyst doesn’t just say, “Sales are down 10%.” They show where, when, and why and recommend what to do next.
6. Business Metrics, KPIs, and Decision-Making
Data analytics isn’t just about technical skills, it's about driving business decisions. A Data Analytics certification helps you understand key performance indicators (KPIs) and business metrics that organizations use to measure success.
You’ll learn how to:
- Define KPIs aligned with company goals.
- Measure performance over time.
- Translate raw numbers into business insights.
For example, you might calculate customer lifetime value (CLV), churn rate, or conversion rate. You’ll then use these metrics to advise management on where to focus resources.
Understanding metrics is vital for analysts who want to influence strategy rather than just crunch numbers.
7. Automation and Workflow Optimization
A modern Data Analytics course goes beyond manual analysis. You’ll learn how to automate repetitive tasks and create workflows that save time.
Using Python, you can automate daily data updates, clean large datasets, and generate reports automatically. You’ll also learn how to schedule recurring data jobs or integrate dashboards with live data sources.
These skills make you more efficient and valuable in any analytics team. They also prepare you for more advanced roles, such as data engineering or business intelligence.
8. Soft Skills: Communication and Critical Thinking
Technical mastery is just half of what makes a successful analyst. Strong communication and critical-thinking skills make the difference between a good and great data analyst.
A data analytics bootcamp or certification emphasizes:
- Translating technical findings into business language.
- Presenting insights clearly and visually.
- Collaborating with non-technical teams.
- Building logical arguments supported by data.
For example, after analyzing churn data, you might explain your findings in simple terms: “Customers who haven’t logged in for 14 days are 60% more likely to cancel their subscription.” Clarity and confidence in communication build trust with decision-makers.
9. Ethics, Data Governance, and Privacy
With great data power comes great responsibility. A good Data Analytics course online teaches you about ethical data practices and governance.
You’ll learn:
- How to handle sensitive data responsibly.
- How to comply with privacy regulations.
- How to detect and reduce data bias.
Understanding data ethics ensures that your analysis is both accurate and fair. You’ll also learn how poor data handling can damage a company’s reputation and customer trust.
10. Capstone Projects and Portfolio Development
At the end of most Data Analytics certification programs, you’ll complete a capstone project and a comprehensive analysis using real-world data.
For example, you might analyze e-commerce sales trends or predict customer churn for a subscription business. You’ll clean, analyze, visualize, and present your findings as if you were an in-house analyst.
This project becomes part of your professional portfolio, a crucial element when applying for jobs. Employers love seeing practical work because it proves you can apply what you’ve learned.
Step-by-Step Learning Journey
To give you a clear path, here’s how your learning typically unfolds in a Data Analytics course online:
Step 1: Foundation
- Learn data concepts, types, and sources.
- Understand what data analysts do.
- Explore the tools you’ll use (Excel, SQL, Python).
Step 2: Data Cleaning
- Handle missing and duplicate data.
- Convert raw data into usable tables.
- Document cleaning steps for transparency.
Step 3: SQL and Database Management
- Query data efficiently.
- Join multiple tables.
- Summarize large datasets using SQL.
Step 4: Python and Scripting
- Automate data preparation.
- Perform calculations and visualizations.
- Build small analytical scripts.
Step 5: Exploratory Analysis
- Identify trends and patterns.
- Apply statistical testing.
- Summarize insights visually.
Step 6: Visualization
- Build dashboards and charts.
- Use storytelling to communicate insights.
Step 7: Business Context
- Define metrics and KPIs.
- Present insights that influence strategy.
Step 8: Capstone Project
- Apply everything you learned to a real dataset.
- Create a report and present it professionally.
Real-World Examples of Data Analytics in Action
Example 1: Retail Sales Decline
A retailer notices a sudden drop in sales. As a data analyst, you collect data from multiple sources—sales transactions, inventory, and marketing campaigns. After cleaning the data, you discover that sales fell in regions with delayed shipments. You present a dashboard that visualizes delivery times and their impact on revenue, leading to logistics improvements.
Example 2: Customer Churn Analysis
In a subscription service, customer churn rises unexpectedly. You analyze usage logs, customer feedback, and subscription history. You find that users who don’t engage with a new feature are more likely to cancel. Based on your insight, the company launches onboarding tutorials to boost engagement and retention improves by 10%.
Example 3: Marketing ROI
You evaluate the performance of three marketing channels: email, search, and social media. By combining spend data with conversions, you find that email campaigns deliver the highest ROI. You recommend reallocating the budget, helping the company save money while increasing conversions.
These examples mirror real assignments you’ll handle in a data analytics bootcamp or certification program.
Why the Google Data Analytics Certification Stands Out
The Google Data Analytics Course is one of the most popular entry-level certifications for aspiring analysts. It’s ideal for beginners because it combines theory, practice, and portfolio building.
You’ll learn:
- How to clean and visualize data using tools like Sheets and SQL.
- How to create dashboards that summarize findings.
- How to complete case studies and present insights.
The course’s strength lies in its structured, practical approach. It’s flexible for online learners and focuses on job-readiness making it one of the most recognized online data analytics certificates available.
Choosing the Right Data Analytics Course or Bootcamp
When selecting a Data Analytics certification or data analytics bootcamp, look for these qualities:
- Comprehensive curriculum covering Excel, SQL, Python, statistics, and visualization.
- Hands-on learning with real data projects.
- Portfolio development for showcasing your work.
- Job support such as interview prep and resume workshops.
- Experienced instructors with industry backgrounds.
- Flexible schedules suitable for working professionals.
A strong program balances theory with practice, giving you both the knowledge and confidence to solve real business challenges.
Common Challenges and How to Overcome Them
Challenge 1: Too Many Tools at Once
Start with one tool Excel or SQL before diving into Python. Build confidence gradually.
Challenge 2: Portfolio Anxiety
Don’t wait until the end of your course. Start building small projects early and document everything.
Challenge 3: Communication Gaps
Practice explaining your findings to non-technical audiences. Use plain language and visual aids.
Challenge 4: Real-World Data Messiness
Embrace messy data. It’s part of the job. Learning to handle it efficiently sets you apart from others.
Challenge 5: Staying Consistent
Create a study routine just 1–2 hours daily adds up. Consistency beats intensity when learning complex topics.
Making the Most of Your Online Data Analytics Class
To succeed in an online data analytics certificate or Data Analytics course online, follow these tips:
- Set specific weekly goals.
- Take notes after each lesson.
- Join online forums and peer study groups.
- Practice with open datasets.
- Build and share dashboards publicly.
- Reflect on every project: What worked? What didn’t?
Remember mastery comes from doing, not just watching. Apply what you learn right away.
Why Employers Value These Skills
Employers love analysts who can translate data into strategy. Completing a Data Analytics certification demonstrates:
- Technical competence in SQL, Python, and visualization tools.
- Analytical thinking and statistical understanding.
- Communication and storytelling ability.
- Professionalism and attention to data ethics.
These skills help businesses reduce costs, improve marketing efficiency, and make informed decisions. For you, they open doors to roles like data analyst, business intelligence analyst, and reporting specialist.
Future Trends in Data Analytics
While foundational analytics remains crucial, new trends are shaping the future:
- AI-assisted analytics: Tools that automate insights using artificial intelligence.
- Cloud-based platforms: Analysts increasingly work with cloud databases and big-data tools.
- Data storytelling: Interactive dashboards that blend visuals and narratives.
- Privacy-first analytics: Growing emphasis on ethical data use and governance.
Learning now ensures you’re ready for these evolving demands.
Conclusion
An Online data analytics certificate gives you everything you need to launch a career in analytics from technical expertise to storytelling skills. Through hands-on projects and guided instruction, you’ll learn how to:
- Frame business questions,
- Clean and prepare data,
- Use Excel, SQL, and Python,
- Apply statistics for insights,
- Build dashboards and tell stories,
- Define metrics that drive business success.
Whether you join a data analytics bootcamp or complete the Google Data Analytics Course, your journey will equip you to solve real-world problems and make data-driven decisions confidently.
Key Takeaways
- A Data Analytics certification teaches both technical and business skills.
- Tools like Excel, SQL, and Python are essential for analysis.
- Visualization and storytelling make your insights actionable.
- Hands-on projects prepare you for real job scenarios.
- Continuous learning and portfolio building are key to long-term success.
Start your journey today enroll in a Data Analytics course online and take your first step toward becoming a skilled, job-ready data analyst. The data-driven future is waiting for you to learn the skills to lead it.