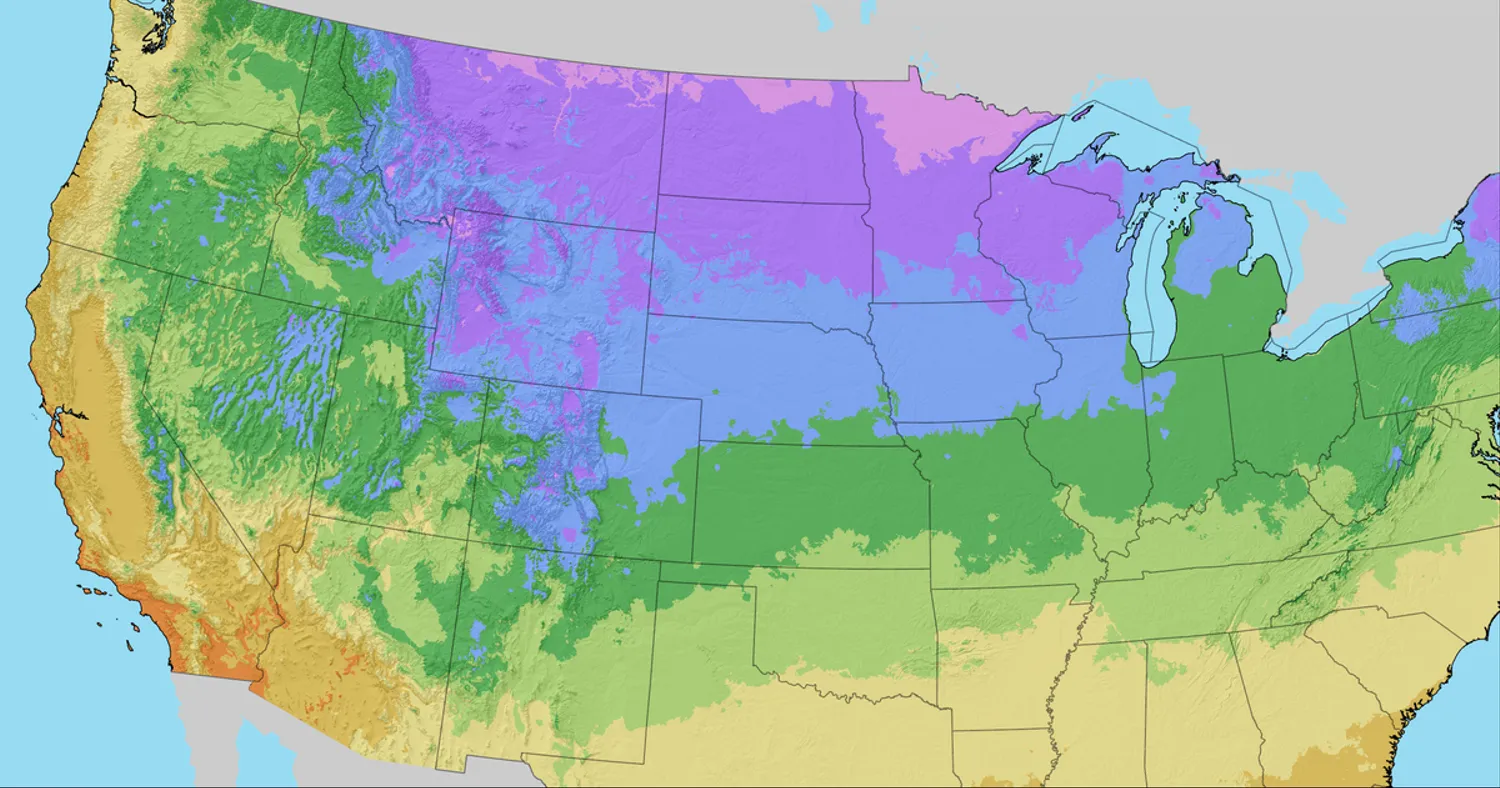
United States Department of Agriculture (USDA) Hardiness Zone Map is one of the indispensable gardeners', landscapers', and farmers' tools. It dictates what plants should most likely flourish in a region by using the lowest winter temperature as a measurement. The USDA Hardiness Zones have not, however, been unchanged over the decades. Climate pattern changes, increased data gathering, and fluctuating environmental conditions have resulted in alterations of these zones, impacting plant choice and growth throughout the nation.
Origins and Evolution of the USDA Hardiness Zone Map
The USDA initially published the Hardiness Zone Map in 1960. It was constructed from weather station data throughout the nation and split the U.S. into 10 zones, each a 10-degree Fahrenheit range of mean annual minimum temperature. The map was revised to 11 zones and with more distinct regional borders in 1990.
A major revision was made in 2012 with more advanced climate modeling and observations over 1976 to 2005. The revision meant having the effect of making most areas advance half a zone warmer, i.e., minimum winter temperatures within them rise. The changes incorporated overall trends of warming and improved data gathering.
Climate Change and Zone Shifts
Probably the most well-documented cause for USDA Hardiness Zone shifts is climate change. Rising global temperatures have produced milder winters for much of the world, requiring zone shifts. Heat has advanced north as ancient colder zones moved back. Areas that once were Zone 5 (-20°F to -10°F winter weather) are currently designated Zone 6 (-10°F to 0°F), enabling plants long not hardy enough for the area to live.
In addition, urbanization and heat islands have also influenced temperature trends. Heat-absorbing high-density infrastructures in urban areas cause warming in localized zones that can modify the viability of plants.
Impacts on Gardening and Agriculture
For gardeners, a change in hardiness zones translates into a change in plant selection. Plants that previously struggled in some areas can now thrive, and those that needed colder winters to go dormant can be damaged. As an example, fruit trees such as peaches and apples, which need a specific amount of chilling hours, can suffer in warmer zones.
Farmers will also need to alter their choice of plants and planting dates. Warmer regions might receive longer growing seasons, but new problems accompany them too, including more pests and altered precipitation patterns.
Future of the USDA Hardiness Zones
As climate change persists, the USDA Hardiness Zones are also likely to shift further. Weather scientists and researchers track temperature trends and revise the map in response. The changes indicate the need for climate-resilient gardening and sustainable agriculture.
The USDA will continue to refine its zone rankings in the future by incorporating additional information regarding unusual weather, droughts, and season shift. Farmers and gardeners can anticipate by keeping a constant watch on zone changes and cultivating varieties resistant to such changes.
Conclusion
The USDA Hardiness Zone Map is still a valuable resource for plant producers, but it is not a static map. Climate shifts, accuracy of data, and environments have influenced zone classifications over time, affecting plant selection and reforming cultivation practices. Growers and gardeners will be in a position to make informed choices as they enjoy these developments, which will bring long-term prosperity to planting projects. Green policies and flexibility will most be essential as the climate shifts, making it optimal for plant growers to reside in an ever-changing environment.