Packages greatly extend the capabilities of Julia. To enter the package manager, type ‘]’ into the REPl. You do not need to hit enter, you’ll notice the prompt immediately changes.
julia>

(v1.3) pkg>
To exit the package manager, press the backspace key, and the prompt will once again return to julia>, ready to accept commands.
There are a couple commands while you are in the package manager that are particularly useful:
- status - this command will list all the installed packages
- update - this comand will update all installed packages to their latest version
- add - this command allows you to install packages. For example, by typing ‘add Gadfly.jl’, Julia will install the Gadfly plotting package
- remove - this command will remove packages. For example, by typing ‘remove Gadfly.jl’, Julia will uninstall the Gadfly plotting package
In order to use the commands within a package, the using command is called. For example, assuming we already have the Gadfly.jl package installed:
julia> using GadflyNote that for the first time calling a package each session, Julia must take time to compile it. Code that relies on the package later in the same session will not have this delay. To learn more about a package, simply input the package’s name (including the .jl) in a search engine to find it’s documentation.
In VS Code, when a plot is outputted, the plot output pane will appear. For example, if we run the following code to output a bar chart and a scatter plot:
julia> using Gadfly

julia> xbar = [1,2,3];

julia> ybar = [5,8,6];

julia> xvalues = [1,2,3];

julia> yvalues = [5,8,2];

julia> plot(x=xbar, y=ybar, Geom.bar)

julia> plot(x=xvalues, y=yvalues, Geom.point, color=[colorant"red"])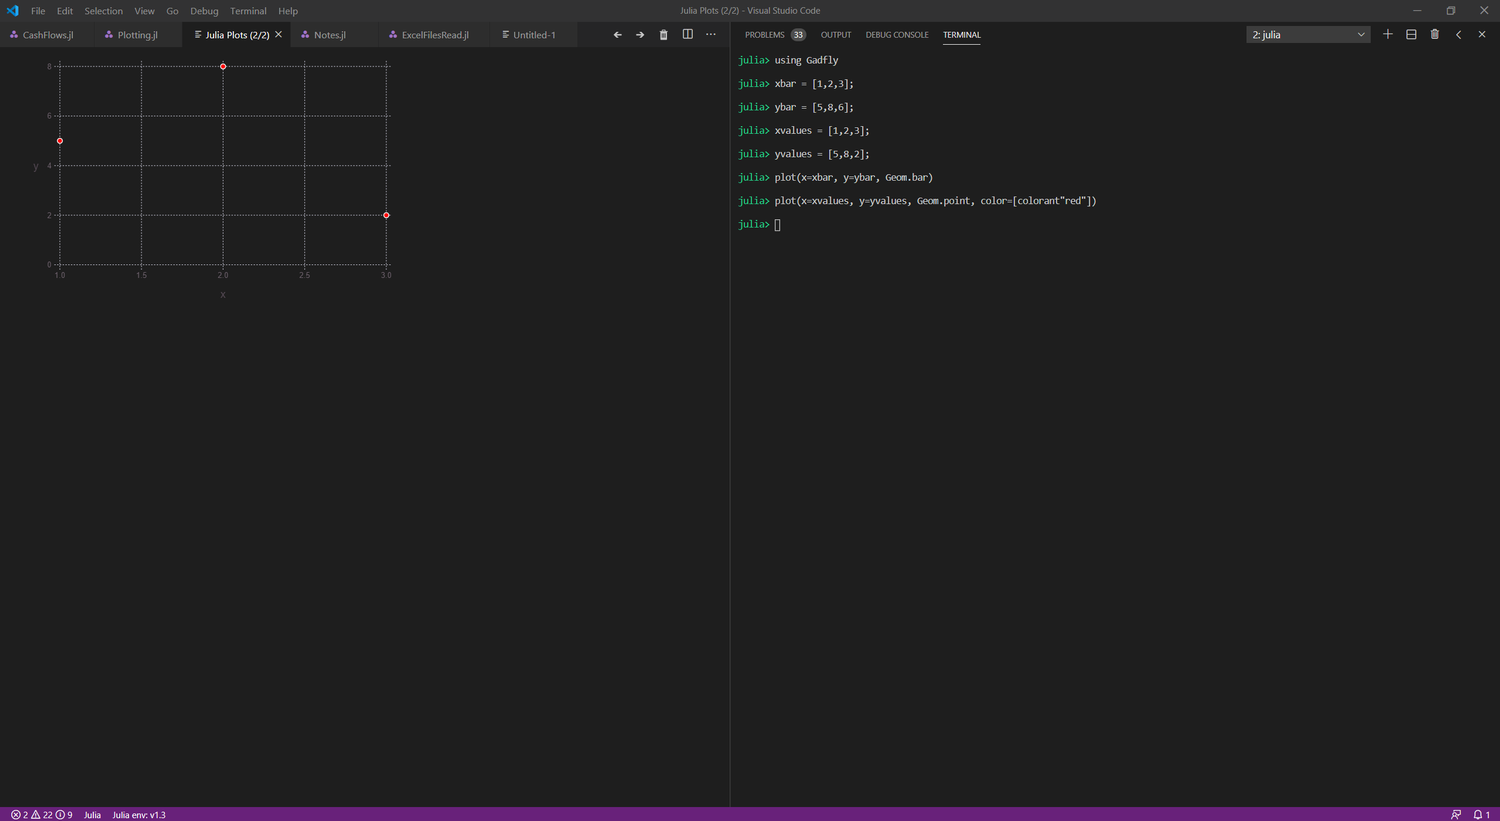
Notice in the plot pane, you may use the arrow controls (or use the arrow keys on your keyboard) to flip between the charts generated.
The Gadfly package also allows you to stack the charts (horizontally or vertically) so they appear next to each other. For example:
julia> p1 = plot(x=xbar, y=ybar, Geom.bar)

julia> p2 = plot(x=xvalues, y=yvalues, Geom.point, color=[colorant"red"])

julia> hstack(p1,p2)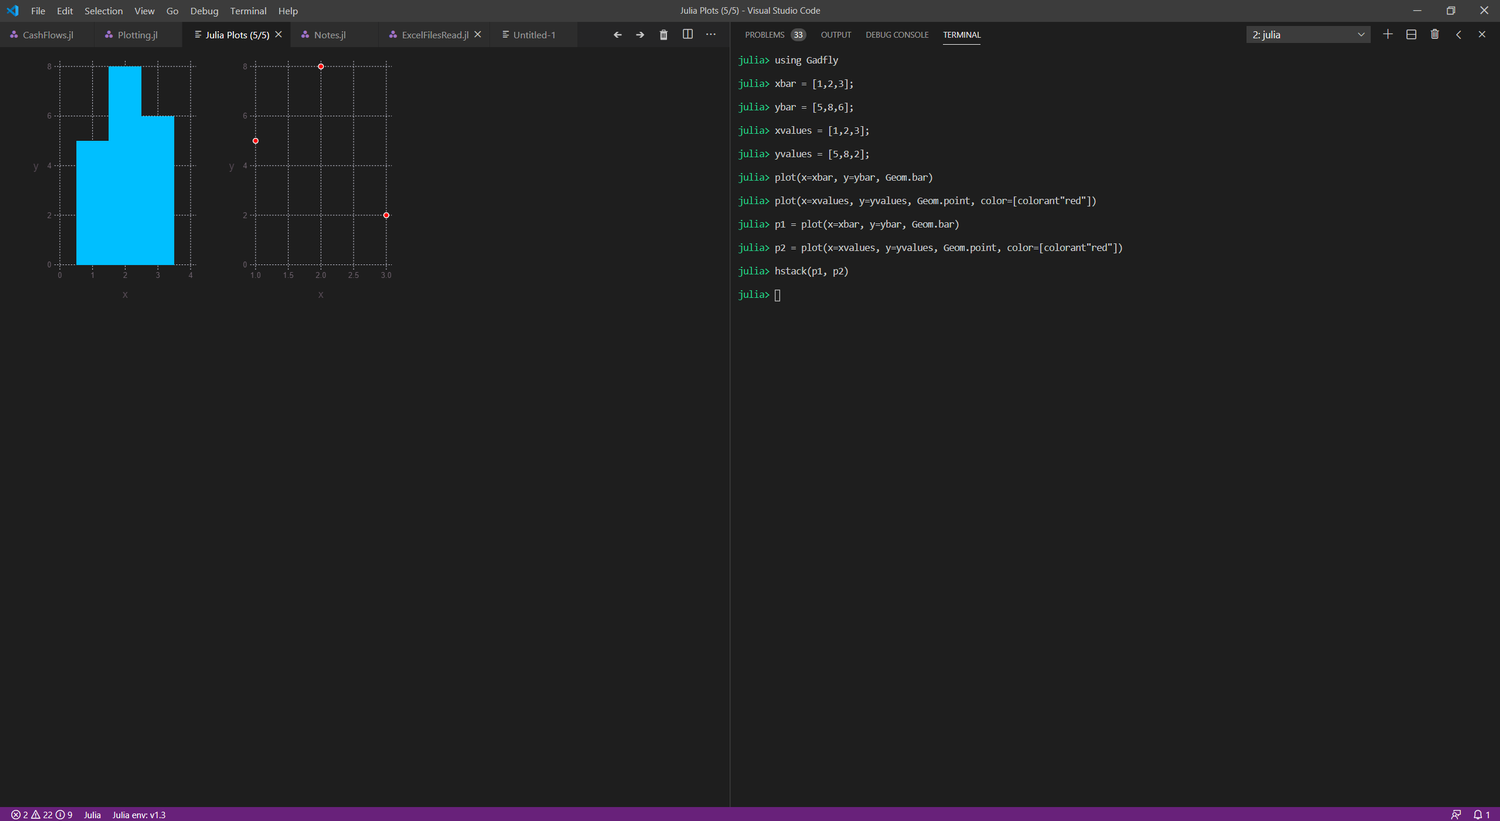
Furthermore, you may superimpose charts on top of each other using Gadfly’s layer functionality:
julia> layer1 = layer(x=xbar, y=ybar, Geom.bar)

julia> layer2 = layer(x=xvalues, y=yvalues, Geom.point, color=[colorant"red"])

julia> plot(layer2, layer1)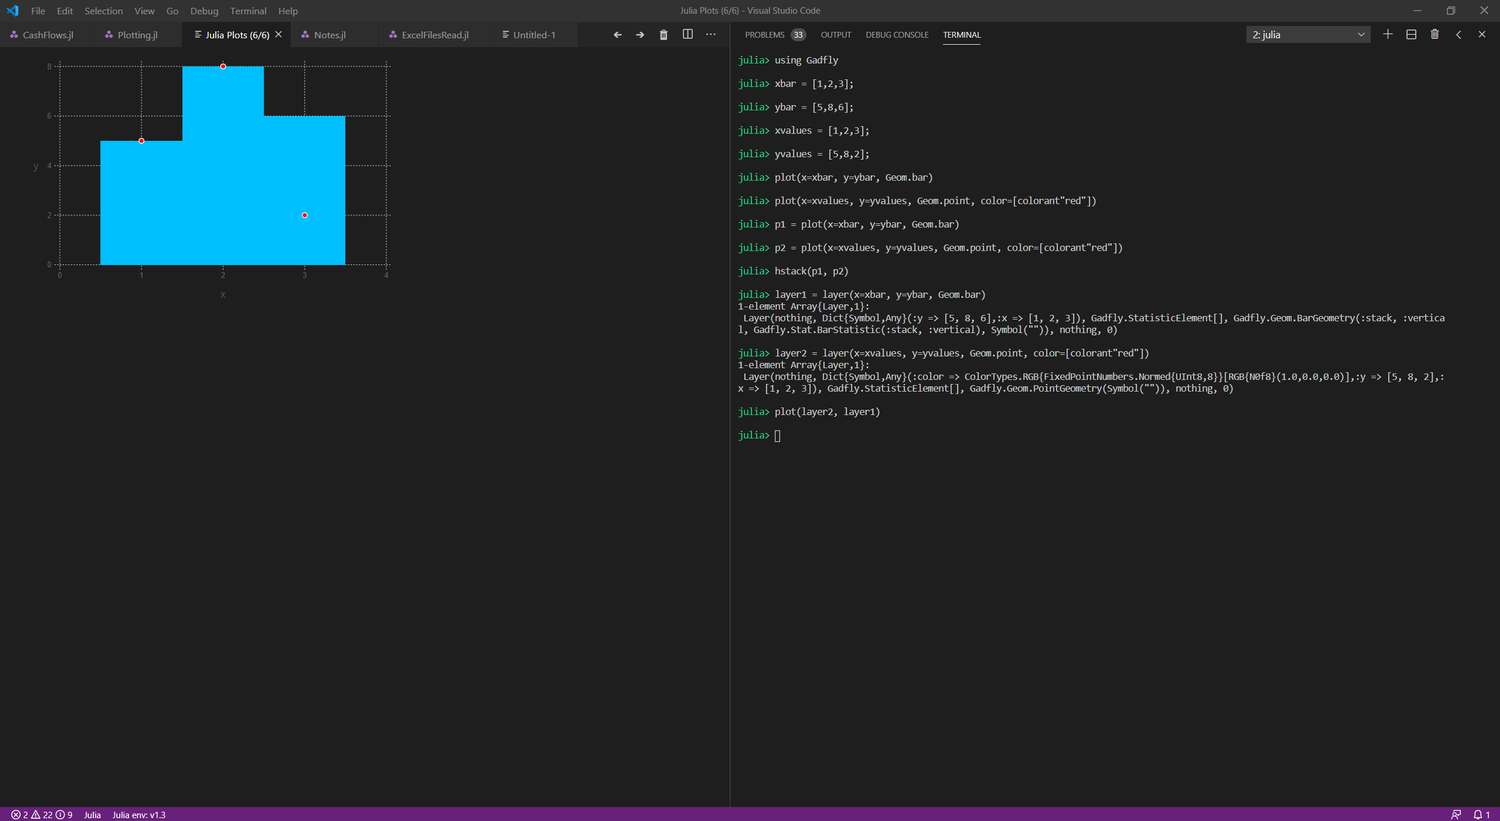
Other plotting packages include:
- StatsMakie.jl
- ECharts.jl
References
[0] Gadfly Package Documentation: https://gadflyjl.org/stable/index.html