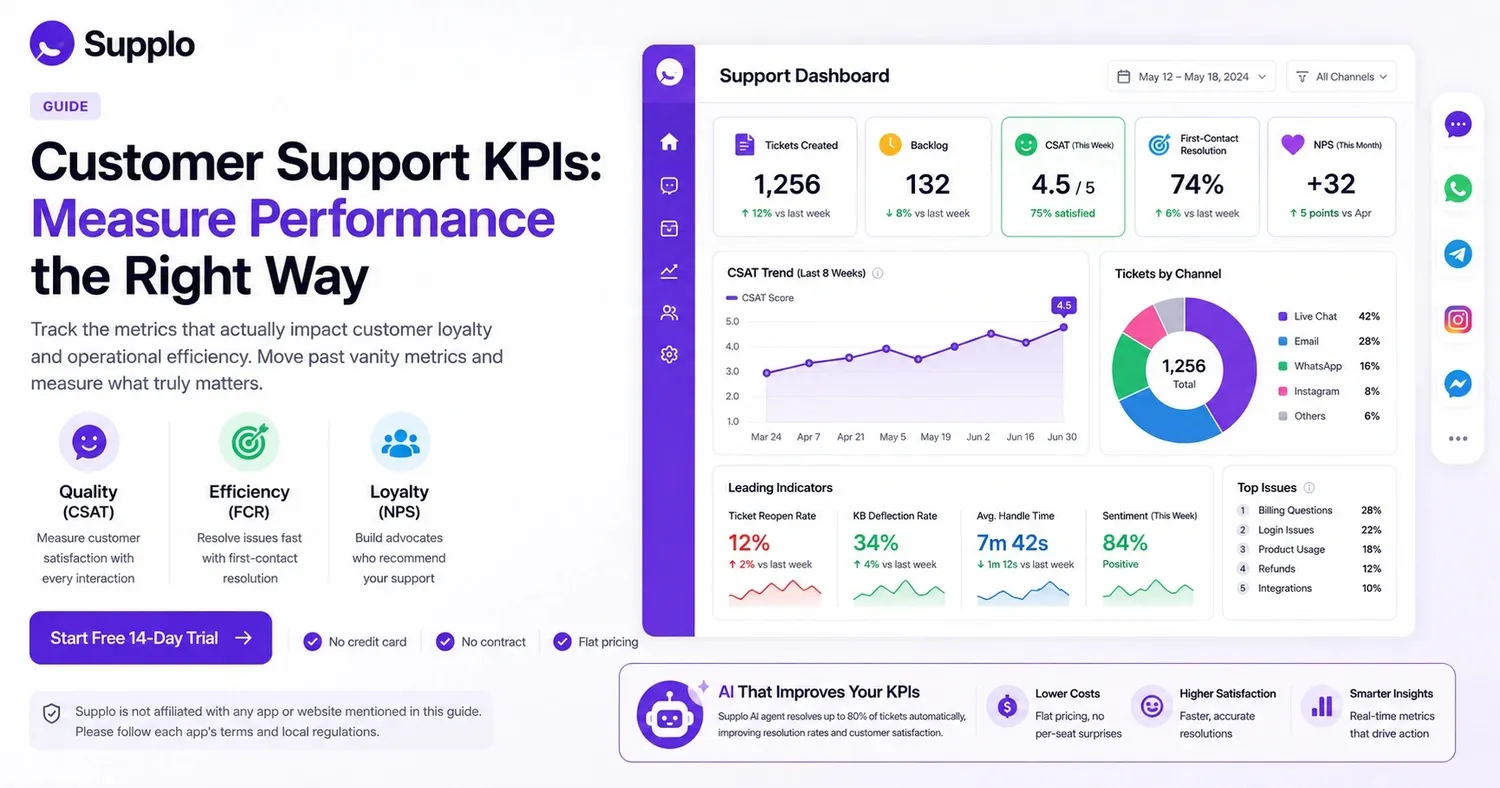
It's less about gathering more data and more about gathering the right data when you're trying to figure out how to accurately measure customer support performance. If you're tired of looking at dashboards filled with numbers that don't actually tell you if customers are happy, you've come to the right place.
This guide is perfect for support leaders and their teams who want to move beyond those "vanity metrics" – the ones that look impressive in meetings but don't really make a difference. We'll focus on the key performance indicators (KPIs) that truly impact customer loyalty and make operations more efficient. And don't worry, we'll show you how to track them without getting buried in spreadsheets.
Quick Answer
- You can measure performance using three main KPIs: CSAT for quality, first-contact resolution for efficiency, and NPS for customer loyalty.
- To calculate CSAT, just divide the number of happy responses by the total responses, then multiply by 100.
- Keep an eye on early indicators like ticket reopen rates and sentiment analysis to spot issues fast.
- Use a simple, single-screen dashboard with only five key metrics to avoid getting overwhelmed by data.
Why Typical Customer Support Metrics Often Miss the Mark, and What You Should Focus on Instead
Here's the deal with measuring customer support: most teams track things like ticket volume and how long it takes to give the first response, then they wonder why customer satisfaction doesn't improve.
The problem is, volume can be a misleading metric. And being fast without being accurate? That often frustrates customers more than a slower, but thorough, reply. You need to combine efficiency metrics with quality indicators like your resolution rate and CSAT.
- A quick first response doesn't mean much if the answer is wrong; you should track first-contact resolution right alongside it.
- An increase in ticket volume could mean your product is super popular or that your knowledge base needs help – same number, totally different implications.
- Don't just pick one metric; use a balanced scorecard that covers efficiency, quality, and loyalty.
- A low CSAT might actually point to a product problem rather than a support issue; use post-chat surveys to get specific feedback for support.
Think of it this way: you wouldn't judge a restaurant solely on how quickly your food arrives, right? You'd also want to know if the food tasted good, if the server was helpful, and if you'd want to go back. The same goes for customer service.
Calculating Your CSAT Score: The Customer Satisfaction Formula That Works
CSAT is figured out by taking the number of satisfied responses (that's typically ratings of 4 or 5 on a 5-point scale) and dividing it by the total survey responses, then multiplying by 100. For instance, if you get 45 satisfied responses out of 60 total, your CSAT is 75%. This single number gives you a quick snapshot of how well your team handled a specific interaction.
It's straightforward, but there's a correct way to approach it.
- CSAT score calculation methods can differ a bit; while some use a 3-point scale, the 5-point scale is generally the standard for benchmarking.
- Send out the survey right after a ticket is resolved; you want to capture their feelings while they're fresh, not days later.
- Avoid averaging raw scores; instead, use the "top two box" method (only count 4s and 5s as satisfied).
- Compare CSAT across different channels. You might find that chat support, email, or social media DMs show very different satisfaction levels. For example, your WhatsApp support might be rocking it while your email responses need some work.
- Supplo's shared inbox automatically tracks CSAT, so you won't have to chase down this data yourself. Check out our inbox to learn more.
Essential Customer Service Metrics: Understanding the Difference Between Efficiency and Quality
Efficiency metrics highlight how quickly your team operates – things like average handle time, first-response time, and tickets per agent. Quality metrics, on the other hand, tell you how well they perform. This includes CSAT, first-contact resolution, and your sentiment score.
The key is to monitor both, because a super-fast team that makes customers unhappy is actually slowing down the process of building loyalty.
- An average handle time under 5 minutes is good for chat, but don't let agents rush through complex issues that need more attention.
- A first-contact resolution rate over 70% usually means you have a strong knowledge base and a well-trained team.
- If your ticket backlog keeps growing week after week, it's a clear sign of team burnout, not just high volume.
- Use quality assurance (QA) rubrics to score and calibrate subjective aspects like tone and accuracy.
- Supplo's AI agent deflection rate and ticket reopen reports offer valuable insights into both your efficiency and the quality of your service. Discover more about our AI agent.
If you ever have to choose between being quick or being correct, always, always choose being correct. You can always improve speed later. But a bad reputation from rushed answers? That's much harder to fix.
How to Calculate NPS for Customer Service: Using the Net Promoter Score for Support
To figure out NPS, simply subtract the percentage of Detractors (those who scored 0–6) from the percentage of Promoters (those who scored 9–10). So, if 40% are Promoters and 20% are Detractors, your NPS would be 20.
For support specifically, send a single question survey after a ticket closes: "How likely are you to recommend our support team?" Then, categorize the responses based on the reason for contact.
- NPS for service is different from product NPS; keep them separate to understand each experience clearly.
- Don't overlook Passives (scores of 7–8); they might be satisfied, but they aren't loyal, meaning a retention risk.
- Track NPS by individual agent to find coaching opportunities without it feeling like a punishment.
- A good support NPS usually falls between 30–50, but it's best to compare it against others in your industry.
If you're thinking about linking bonuses to NPS, you might want to reconsider. It could encourage agents to pressure customers for high scores, which defeats the whole purpose.
Customer Support Performance Indicators: Understanding Leading vs. Lagging Measures
Lagging indicators, like your monthly CSAT and NPS scores, tell you what already happened. But leading indicators, such as customer sentiment during a live chat, your ticket reopen rate, and how often your knowledge base diverts tickets, give you a heads-up about what's coming.
If "reopen rates" suddenly jump in the middle of the week, you've got a quality issue today, not something you'll find out about next month when the CSAT report arrives.
- A ticket reopen rate above 15% suggests your initial replies aren't thorough enough.
- A knowledge base deflection rate above 30% indicates your self-help resources are doing their job.
- A drop in customer sentiment during an interaction is a real-time warning sign; agents can fix it before the CSAT survey even goes out.
- Daily and weekly checks help you react much faster compared to waiting for monthly reports.
This is where a lot of teams get stuck. They wait for the monthly report to see what went wrong, even though they could have caught it days or weeks earlier by monitoring the right leading indicators.
Evaluating Customer Loyalty in Support: More Than Just a Score
Loyalty isn't just a survey score; it shows up when customers make repeat purchases, are less likely to churn, and choose you over cheaper alternatives.
In support, you can measure loyalty by looking at the repeat contact rate (how often the same customer submits tickets) and their customer effort score (how much effort they had to put in to get help).
- A low customer effort score strongly correlates with a higher likelihood of repurchase; less effort means more loyalty.
- A repeat contact rate under 10% usually points to excellent first-contact resolution and strong self-help options.
- Combine NPS with your cohort-level churn rate to see if promoters truly stick around longer than detractors.
- Qualitative feedback, like "that was easy" or "I had to explain everything twice," reveals loyalty drivers that numeric scores often miss.
Supplo's multichannel support inbox helps you track loyalty across platforms like WhatsApp, Telegram, and Instagram, giving you a complete overview. Discover more about our WhatsApp support.
Tracking Customer Support Success with a Simple Dashboard
A useful support dashboard should fit on one screen and display: daily ticket volume, current backlog, average weekly CSAT, first-contact resolution rate, and the NPS trend.
Make sure to refresh it daily, and resist the urge to add every single metric you can think of. You're looking for clear signals for action, not just more data.
- Try a four-box layout: volume in the top left, quality in the top right, efficiency in the bottom left, and trend lines in the bottom right.
- Set weekly targets instead of monthly ones so you can adjust course before the quarter ends badly.
- Share the dashboard with the entire team, not just management; transparency fosters ownership.
- Supplo's inbox and AI agent automatically log these metrics, so you won't need a separate reporting tool. Learn more about our pricing and features.
If your dashboard has more than five numbers, you're probably making things too complicated. Simplify it and see what truly gets used.
NPS Customer Support Strategy: Turning Feedback into Meaningful Action
An NPS score is just a vanity number if you don't have a follow-up process in place.
- For promoters, ask them for a testimonial or a review.
- For detractors, have a senior team member follow up personally within 48 hours.
- For passives, share a helpful resource or tip; they're often the simplest group to convert into promoters.
- Tag detractors in your CRM and set up a workflow to schedule a manager call within two business days.
- Close the loop with promoters by inviting them to a product beta or a loyalty program.
- Analyze NPS by topic (like billing, technical, or product issues) to understand where support experiences differ.
- Benchmark your NPS quarterly, but act on it weekly; the trend is more important than a single score.
Measuring Customer Advocacy: When Support Creates True Promoters
Advocacy happens when customers don't just stick around; they actively tell others about you.
You can measure this by looking at referral requests from support interactions, mentions on social media, and the percentage of customers who leave a review after a positive experience. The simplest advocacy metric is the proportion of promoters who actually recommend you.
- Track the net promoter share (promoters minus detractors) as a raw count, not just a percentage.
- Include "Would you refer us to a colleague?" as a standalone question in your post-support surveys.
- Keep an eye on third-party review sites and support tickets that mention "I recommended you to..." as organic signs of advocacy.
- Advocate customers typically have lower support costs and higher lifetime value; connect this data in your reporting.
Supplo is committed to promoting legitimate uses of our services. We are not affiliated with any app or website. Please follow each app's terms and local regulations.
Setting Up Your First Customer Support KPIs
Start with three metrics: CSAT for overall quality, first-contact resolution for efficiency, and the ticket volume trend to understand your workload. Track these for two weeks to establish a baseline. Then, add NPS for loyalty and your ticket reopen rate for accuracy. Only expand further once you're confident you can consistently track these initial five.
Steps:
- Clearly define what "resolved" means for each type of ticket, as this can differ across industries.
- Set up automated post-ticket surveys (Supplo does this automatically within the inbox).
- Choose a weekly review schedule, rather than daily scramble.
- Share the first two weeks of baseline data with your team before setting any targets.
- Review and adjust metrics every quarter; your KPIs should evolve as your support operations mature.
Common Pitfalls in Measuring Customer Service Quality and How to Avoid Them
The biggest pitfall is survey fatigue; if you ask for feedback after every single interaction, your response rates will drop, and your scores will become unreliable.
Another common error is comparing CSAT across different ticket types (like billing vs. technical support) without segmenting them. Also, don't set targets without historical data; you'll just frustrate your team.
- Consider sampling only 20–30% of closed tickets instead of surveying every interaction to improve data quality.
- Segment CSAT by issue type, channel, and even time of day; a low score at 2 AM probably indicates wait times more than an agent's skill.
- Avoid linking bonuses to a single metric, such as first response time; this often encourages quick but shallow replies.
- Implement a red-yellow-green alert system: green means you're on track, yellow needs attention, and red requires escalation.
- Avoid survey fatigue with the built-in feedback tools in Supplo's widget. Learn more about our widget features.
Take our free trial offer!
Want to see these KPIs in action without having to build a dashboard from scratch? Start your free 14-day trial at Supplo.io; your CSAT, NPS, and resolution data will automatically populate from day one.
A better way to get started:
Tired of inaccurate survey data and manual reporting? Supplo's AI agent can resolve up to 80% of tickets automatically and logs all the metrics you need. Begin your free trial at Supplo.io and experience the difference.
Keep using it:
Customer support KPIs aren't a one-time project; they're a continuous feedback loop. Supplo keeps your metrics live, your team aligned, and your costs predictable with a flat rate and no per-seat surprises. Try it free for 14 days at Supplo.io.
Key Takeaways
- Measure performance using three core KPIs: CSAT for judging quality, first-contact resolution for gauging efficiency, and NPS for understanding customer loyalty.
- To calculate CSAT, divide the number of satisfied responses by the total responses, then multiply by 100.
- Keep an eye on leading indicators, such as the ticket reopen rate and customer sentiment, to catch problems early.
- Use a simple, single-pane dashboard with only five key metrics to prevent data overload.
FAQ
How often should I measure customer support performance?
At a minimum, you should check leading indicators like your ticket reopen rate and backlog weekly. For lagging indicators like CSAT and NPS, monthly is usually sufficient. Daily tracking can create too much noise, while quarterly tracking means you'll miss too many issues.
What's the difference between CSAT and NPS when it comes to support?
CSAT measures satisfaction with a single interaction, while NPS gauges overall loyalty and how willing someone is to recommend your support team. Both are valuable, but they answer different questions about customer experience.
Is the first response time still an important KPI?
Yes, it is, but only if you pair it with a quality metric. A fast but incorrect answer is worse than a slightly slower but accurate one. Track first response time alongside first-contact resolution for a balanced perspective.
How do I calculate the customer satisfaction score if I'm using a 10-point scale?
The formula remains the same: divide the number of satisfied responses (8–10 on a 10-point scale) by the total responses, then multiply by 100. Alternatively, you can normalize it to a 5-point scale for industry benchmarking.
Should I measure agent performance using individual KPIs?
Be careful with this. Individual metrics are great for coaching and helping agents improve personally, but avoid public rankings or bonus structures tied to a single metric. Team-level metrics typically lead to better collaboration.
What's considered a good first-contact resolution rate?
A rate above 70% is generally considered strong for most B2B and B2C support teams. If your score is below 60%, it suggests your knowledge base or agent training needs some attention. Keep in mind that industry norms vary, so it's always good to benchmark against your own past performance.
Can AI support tools like Supplo help me track these metrics automatically?
Absolutely! Supplo's AI agent and shared inbox automatically log CSAT, NPS, ticket volume, reopen rates, and resolution data. This means you won't need a separate reporting system. The AI agent can also deflect common questions, which helps improve first-contact resolution rates.
Compliance: Supplo is not affiliated with any app or website mentioned in this guide. Please make sure to follow each app's terms and local regulations.