When you adopt software for your infrastructure, licensing shapes what you can do with code, what obligations you inherit, and what freedoms you retain. BSD licenses represent permissive licensing that lets you modify, distribute, and use code with minimal restrictions. For infrastructure projects, this distinction matters significantly. These fundamentals form the foundation for deeper Linux network administration. For broader system administration topics, explore https://blog.hofstede.it.
How Does BSD Licensing Differ from GPL?
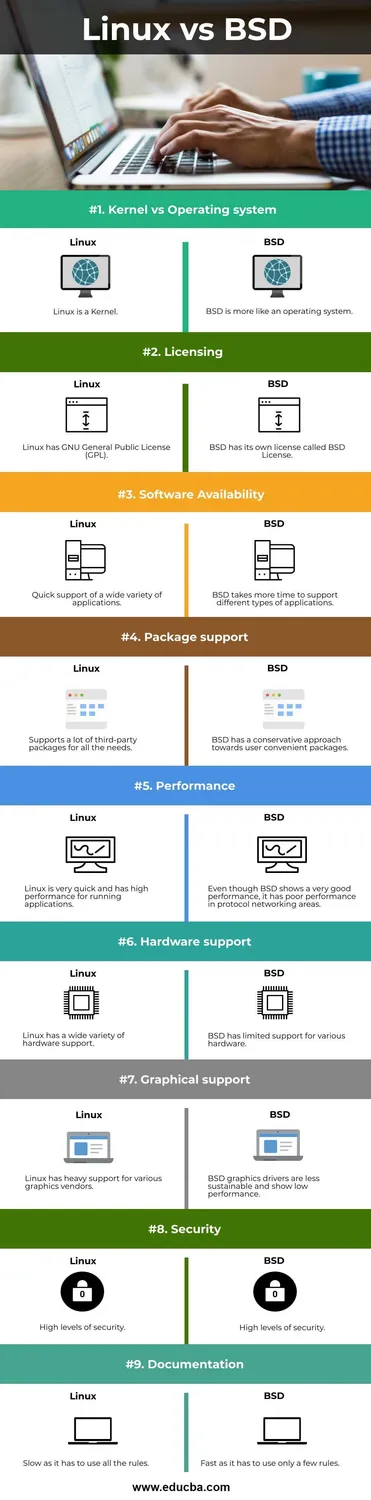
BSD and GPL represent fundamentally different philosophies about software freedom. BSD licenses (particularly the 2-Clause and 3-Clause variants) allow you to use, modify, and distribute software with minimal restrictions beyond attribution. GPL, by contrast, is "copyleft": if you modify GPL code and distribute it, you must release your modifications under the same GPL terms. This means proprietary modifications stay proprietary under BSD but must be open-sourced under GPL.
For infrastructure, this distinction has teeth. Building a monitoring tool or deployment framework on top of GPL software forces you to choose between going open-source or not releasing code at all. BSD lets you build proprietary layers without that pressure. Infrastructure teams prefer this because operational tools often contain business logic they can't or won't publish.
The 2-Clause BSD license is minimal: just attribution requirements. The 3-Clause variant adds a non-endorsement clause. Both are brief. GPL, meanwhile, runs hundreds of lines and creates legal obligations that ripple through your entire codebase if you link against GPL libraries.
Why Do Infrastructure Projects Choose BSD Licenses?
Infrastructure software tends toward BSD licenses because permissiveness reduces friction at deployment time. Integrating monitoring, orchestration, or logging tools into production environments often requires modification: adding custom exporters, tweaking configurations, patching behaviors for specific hardware or network topology. BSD licensing says "modify away." GPL licensing requires you to either contribute changes upstream, keep them proprietary (illegal), or open-source everything.
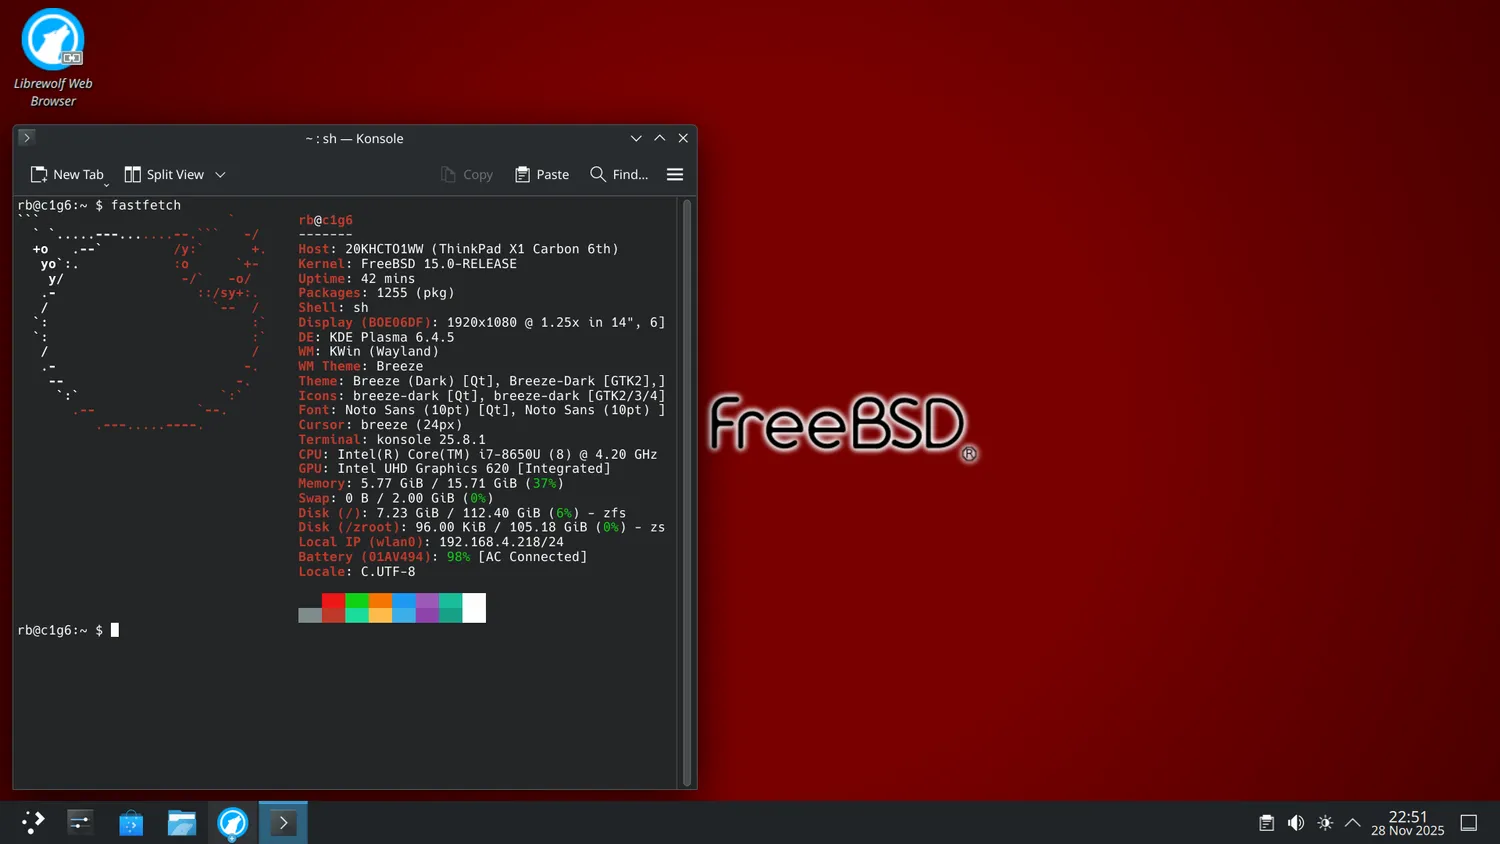
Consider FreeBSD itself. Built largely on BSD-licensed code, it can integrate proprietary device drivers, hardware-specific optimizations, and vendor-specific features without triggering GPL obligations. Companies like NetApp, Juniper, and others have built substantial products on BSD code precisely because they can layer proprietary functionality without legal conflicts.
What Are the Actual Business Implications?
From a business perspective, BSD licensing affects three areas: adoption, contribution, and liability. Adoption is often faster because there's no "licensing review" period. Many organizations have blanket policies against GPL software in production. BSD gets a green light faster, which matters for tools competing in crowded spaces like metrics, logging, and service orchestration.
Contribution is different. GPL creates pressure to contribute improvements back because forking is legally tricky. BSD removes that pressure. This can mean less upstream engagement, but teams fork freely without guilt or legal fear. BSD projects often see fewer contributions but more forks. GPL projects see more contributions but sometimes less diversity.
Liability is subtle but important. BSD licenses typically disclaim all warranties: use at your own risk. GPL does the same but with copyleft obligations attached. Both put responsibility on you for testing and vetting. From a legal perspective, BSD is cleaner to review because fewer conditional obligations hide in the legal text.

How Do Licensing Choices Shape the Infrastructure Ecosystem?
The licensing you choose for your infrastructure tools affects not just your project but the ecosystem around it. The choice between BSD and GPL licensing has historically driven which tools got adopted on which platforms. FreeBSD projects lean BSD. Linux projects are mixed, though GPL-licensed tools often dominate because Linux itself is GPL.
This shapes hiring, knowledge sharing, and tooling decisions. If your infrastructure stack is built on BSD licenses, you're signaling flexibility and proprietary integration. If it's GPL, you're signaling transparency and shared improvement. Neither is wrong; they just have different gravity.
If you're building a system administration framework targeting BSD and Linux, BSD licensing makes it easier to package for different distributions and let operators modify freely. GPL licensing makes it easier to ensure improvements flow back to your project. Choose based on what you actually want your user community to do. Larvitz Blog covers tools and practices across BSD and Linux systems.
What's the Right Choice for Your Project?
There's no universal answer, but the question itself is worth asking. If you're building infrastructure software, consider: Do you want users forking freely or contributing back? Can you tolerate proprietary modifications of your work? Do you need to integrate with proprietary tools? Is your user base conservative about licensing risk? Will you need to integrate with GPL-licensed components?
For most infrastructure projects, BSD licensing removes friction. It says "use this however you need." For tools where community contribution is the core value, GPL makes sense.
The licensing question isn't academic. It's a design decision that shapes what your users can do, what liability you carry, and what community gravitates toward your work. Choose deliberately, not by default.
-------------------------------------------------------------------------------------------------------------------------------------------
Monitoring Your Servers with Prometheus and Grafana

Building visibility into your infrastructure means answering two separate questions: What happened? (logs) and How much happened? (metrics). Prometheus and Grafana form the de facto standard for metrics. Prometheus scrapes metrics from servers and applications, storing them as time-series data with a query language called PromQL. Grafana reads those metrics and turns them into dashboards, charts, and alerts. This combination gives real-time insight into CPU, memory, disk, application behavior, and custom metrics you define.
What's the Difference Between Metrics and Logs?
Logs are narrative: sequences of events describing what happened. Metrics are aggregate: snapshots of quantities right now. When your application crashes, logs show stack traces and error messages. Metrics show that CPU spiked, memory filled, or request latency doubled five minutes before the crash.
Metrics are numbers: CPU percentage, request count, bytes transferred, queue depth, error rate. They're low-volume (thousands per minute vs. millions of log lines). They're designed for time-series storage: each metric has a timestamp, label set (which server, process, endpoint?), and value. This structure makes them perfect for graphing trends, detecting anomalies, and triggering alerts.
Logs answer "why." Metrics answer "what, how much, when." You need both, but they're fundamentally different. Prometheus is built for metrics, not log aggregation. For logs, use Loki, ELK, or Splunk instead.
How Do Exporters and Scraping Work?
Prometheus pulls metrics instead of waiting for systems to push them. Your servers run small HTTP endpoints (usually port 9100 for Linux) that respond with metrics in simple text format. Prometheus periodically queries these endpoints (default every 15 seconds) and stores the results. These endpoints are called exporters.
An exporter converts system metrics into Prometheus format. Node Exporter reads CPU, memory, disk, and network stats. MySQL exporter reads replication lag and query performance. Nginx exporter reads request counts and response codes. You can use community exporters for most software or write your own quickly.
The scraping process is straightforward: Prometheus maintains a target list (each is "host:port/path"). It makes HTTP GET requests on schedule. The exporter responds with newline-delimited metric lines. Prometheus parses, timestamps, and appends them to its time-series database. If a scrape fails, Prometheus marks the target down and retries. Targets can be static (configured in a file) or dynamic (via Consul, Kubernetes, or service discovery).
What Does a Basic Dashboard Look Like?
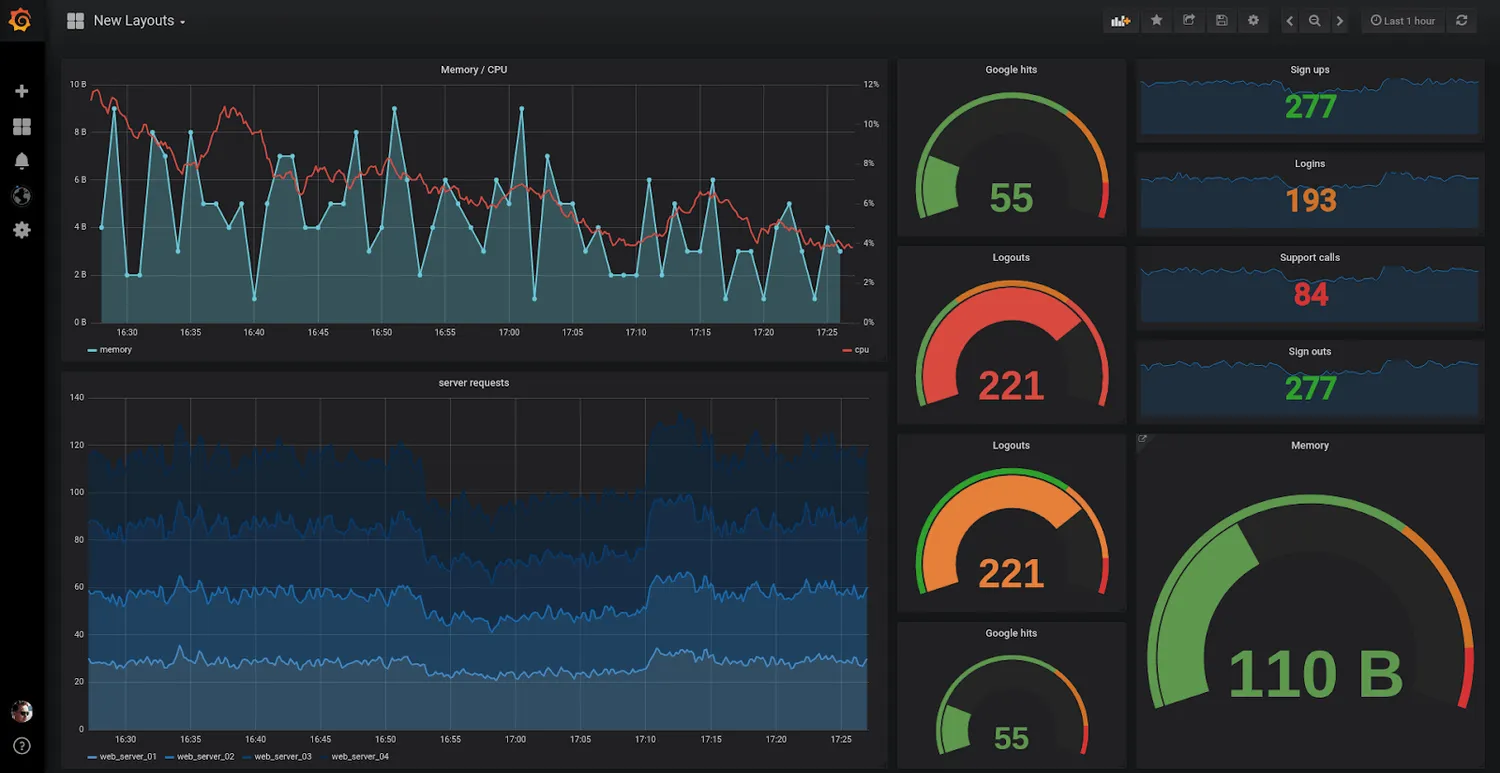
Grafana reads metrics from Prometheus and turns them into charts. Point Grafana at your Prometheus server, tell it which metrics to graph, and it renders them. A basic web server dashboard shows requests per second, response latency percentiles, error rate, CPU and memory usage, disk I/O, and network traffic.
Each panel is a PromQL query. rate(http_requests_total[5m]) gives requests per second over 5 minutes. histogram_quantile(0.95, http_request_duration_seconds_bucket) gives 95th percentile latency. node_memory_MemFree_bytes / node_memory_MemTotal_bytes * 100 gives free memory percentage.
The dashboard updates in real-time as Prometheus scrapes. You can zoom into time ranges, hover over data points to see exact values, and set thresholds so panels change color when needed (green for good, yellow for warning, red for critical).
Building good dashboards takes time, but the community has already built dashboards for most common software. Import one from Grafana Labs' store, tweak it for your environment, and go live in minutes.
How Do Alerts Get Triggered?
Alerting uses recording rules and alert rules. A recording rule runs on schedule and stores its result as a new metric. An alert rule triggers notifications when the result is true.
A simple alert: if node_load1 > 4 for five minutes, fire an alert. This evaluates node_load1 > 4 every interval. If true for five minutes straight, send a notification to Slack, PagerDuty, or email. If it becomes false before five minutes, the alert clears.
Prometheus fires alerts to an Alertmanager instance, which handles routing, grouping, and deduplication. Alertmanager routes based on labels: send database alerts to database teams, infrastructure alerts to ops, application alerts to dev teams. It groups related alerts, suppresses duplicates, and silences alerts during maintenance.
For effective alerting, set thresholds based on your actual baselines. Critical CPU might be 80% or 95% depending on your workload; critical disk might be 85% or 90%. Context matters, so don't copy thresholds from the internet without adapting them. Bad alerts breed fatigue; good alerts wake you only when something's actually wrong.
Where Should You Start?
Begin with Prometheus and Node Exporter on your most critical server. Configure Prometheus to scrape every 30 seconds (faster feedback for learning). Set up Grafana and import a Node Exporter dashboard. Spend a week reading the dashboard, understanding your baseline, noting normal vs. concerning patterns. Add more servers, exporters, and custom application metrics. Build alerting once you understand your environment well enough to set meaningful thresholds. You can find more infrastructure patterns at blog.hofstede.it.
------------------------------------------------------------------------------------------------------------------------------------------
About Us

You're probably here because you've grown tired of shallow tutorials, misleading benchmarks, and content written to sell you something. If you work with FreeBSD, Linux, or other Unix-like systems, you know the difference between surface-level explanations and material that actually helps you understand what's happening beneath the hood.
Larvitz Blog exists for professionals like you. We write for developers and system administrators who choose their tools based on merit, not momentum. The people who think about long-term maintainability. The people who understand that operational reliability is a feature, not a side effect. We're here for those who recognize that clean engineering compounds and that understanding your infrastructure matters at every level.
Our content covers what you actually need: FreeBSD and Linux system administration, BSD operating systems, architectural patterns, and clean engineering practices. Not trends. Not vendor announcements dressed up as innovation. Real technical work that solves real problems. We focus on the substance of these systems—how they work, why they work that way, and how to work effectively with them.
The internet is full of technical content, but much of it optimizes for clicks rather than clarity. We optimize for utility. That means our articles may not update daily, but they will still be useful a year from now. That means we explain the reasoning behind recommendations, not just the commands to run. That means we acknowledge tradeoffs instead of pretending best practices always have obvious answers. We think the work deserves that rigor.
Your time matters, and you have standards for what you read. Whether you're debugging kernel behavior, redesigning your infrastructure, or building a system from first principles, you deserve resources created by people who've done the work themselves. Larvitz Blog is built on that premise. We respect your expertise, and we share it openly with the depth it deserves.
------------------------------------------------------------------------------------------------------------------------------------------
Contact Info

Email : christian@hofstede.it
------------------------------------------------------------------------------------------------------------------------------------------
Top Links
https://www.phoronix.com/news/FreeBSD-drm-kmod-Linux-6.12
https://www.howtogeek.com/difference-bsd-and-linux/
https://hackaday.com/2025/11/11/moving-from-windows-to-freebsd-as-the-linux-chaos-alternative/
https://www.zdnet.com/article/freebsd-linux-review/
https://itsfoss.com/news/distros-response-age-verification-laws/
------------------------------------------------------------------------------------------------------------------------------------------
Infographic