MACD is short for moving average convergence/divergence. It's a trading indicator used in technical analysis.
Created in the 1970s by Gerald Appel, MACD is supposed to reveal changes in trend strength, direction, momentum, and duration of an asset’s price.
What Exactly Does MACD Measure?
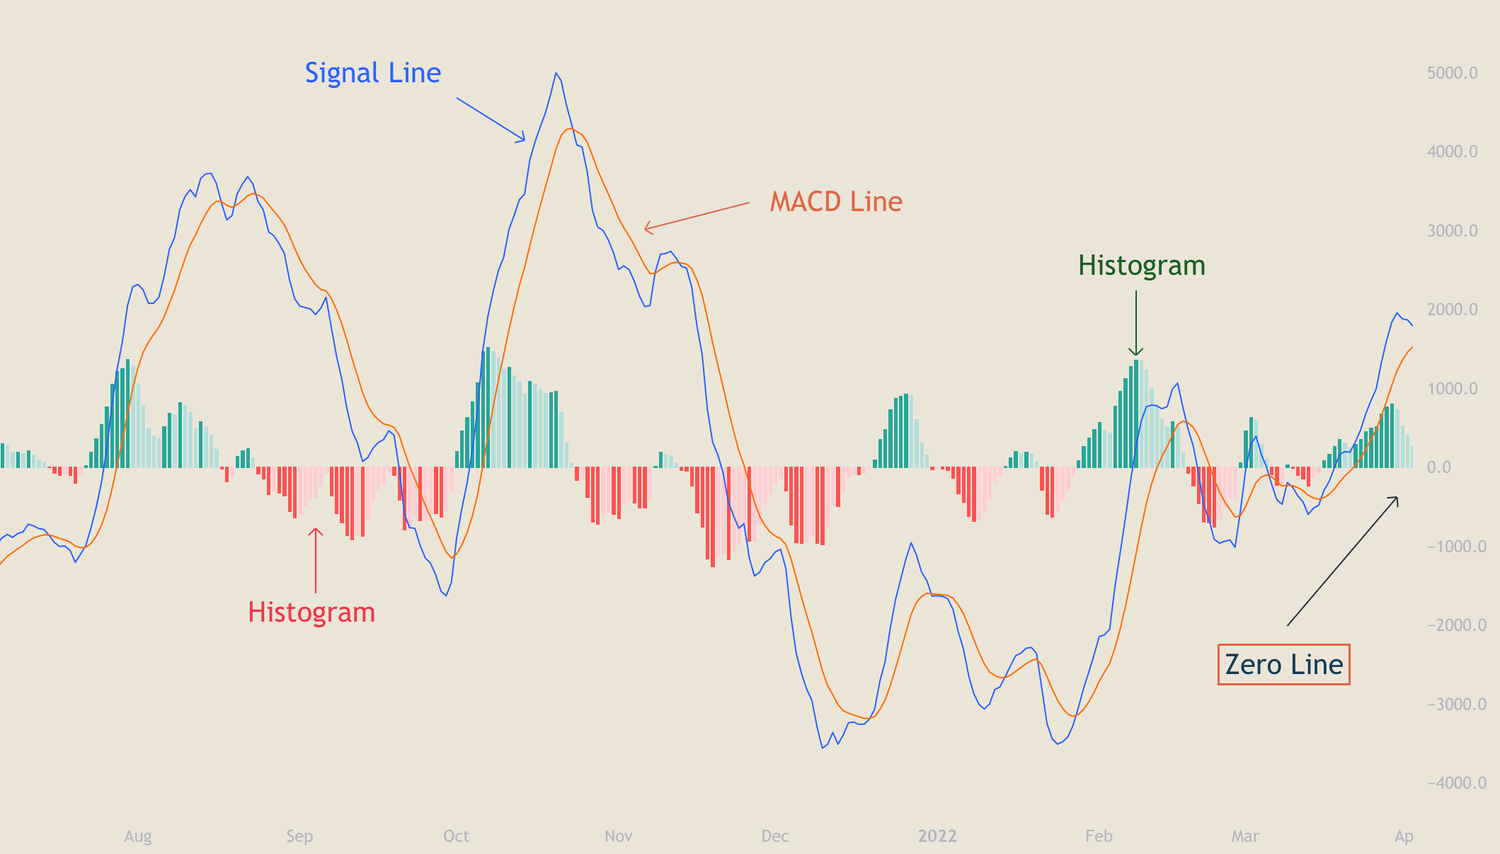
The indicator (or oscillator) displays the price relationship between two moving averages.
It’s calculated by subtracting the 26 period EMA (exponential moving average) from the 12 period EMA. It produces the MACD line.
A 9 period EMA of the MACD is plotted on top of the MACD line.
You can additionally add a histogram to your indicator. Which graphs the distance between the MACD and signal trend lines.
If the MACD is above the signal line, the histogram displays the distance between the MACD and the signal line.
If the MACD is below the signal line, the histogram displays the distance between the MACD and the signal line.
How Do Traders Use MACD?
Traders look for a change in trend or to understand the severity of the trend.
They are looking to identify strengthening (bullish) or weakening (bearish) momentum.
It’s believed to be most effective during wide-swinging trading markets. And is normally used in conjunction with other indicators.
Traders are looking for these signals:
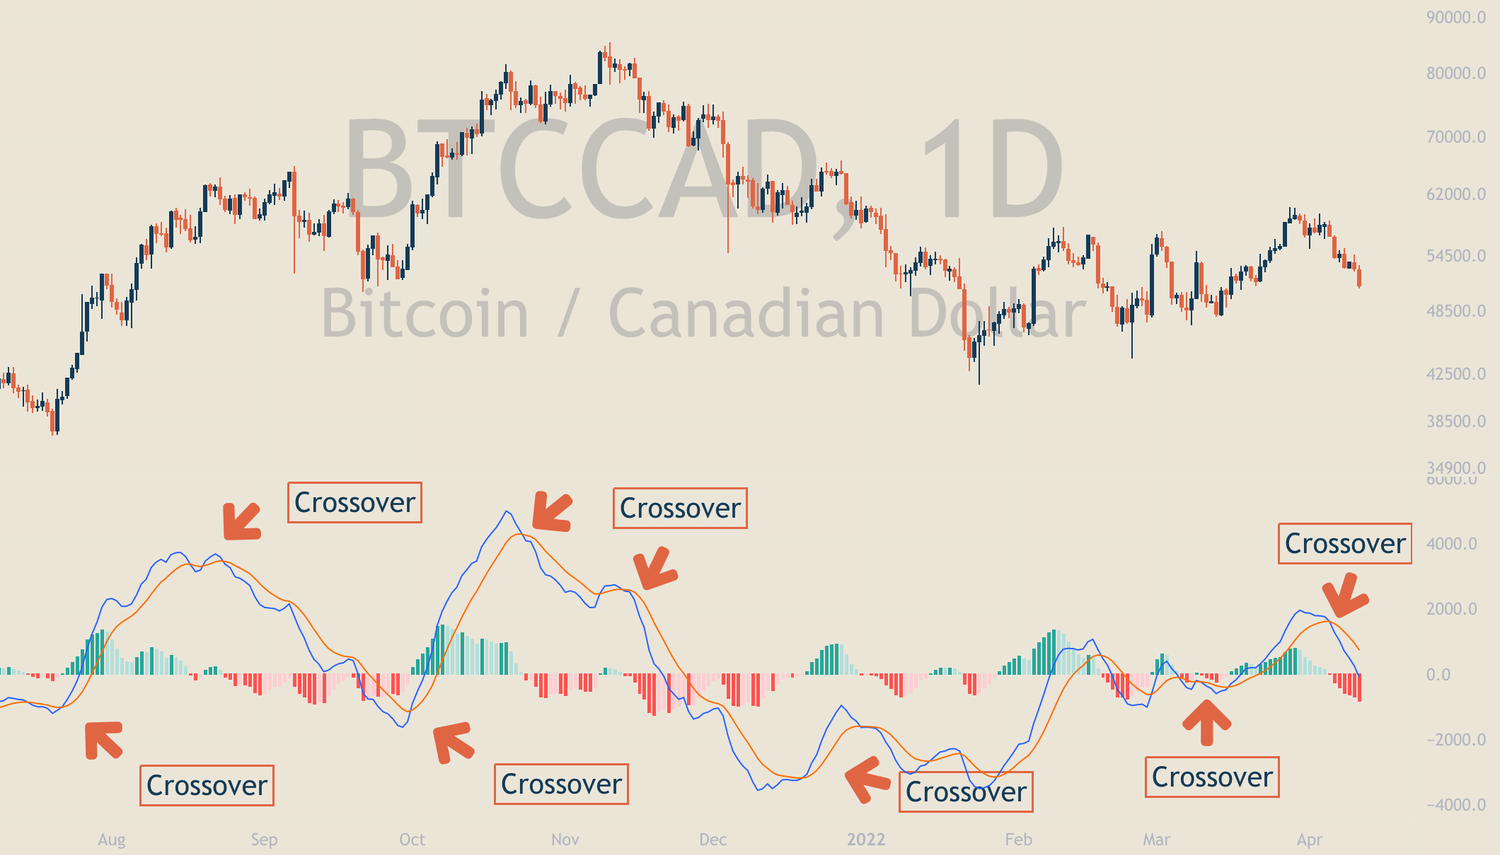
Crossovers
There are two.
The first is when the signal line and the MACD line crossover.
The second is a zero-line crossover. This is when both the MACD and the signal line crossover the middle (or zero) line.
Both indicate a possible change in price momentum.
Divergence
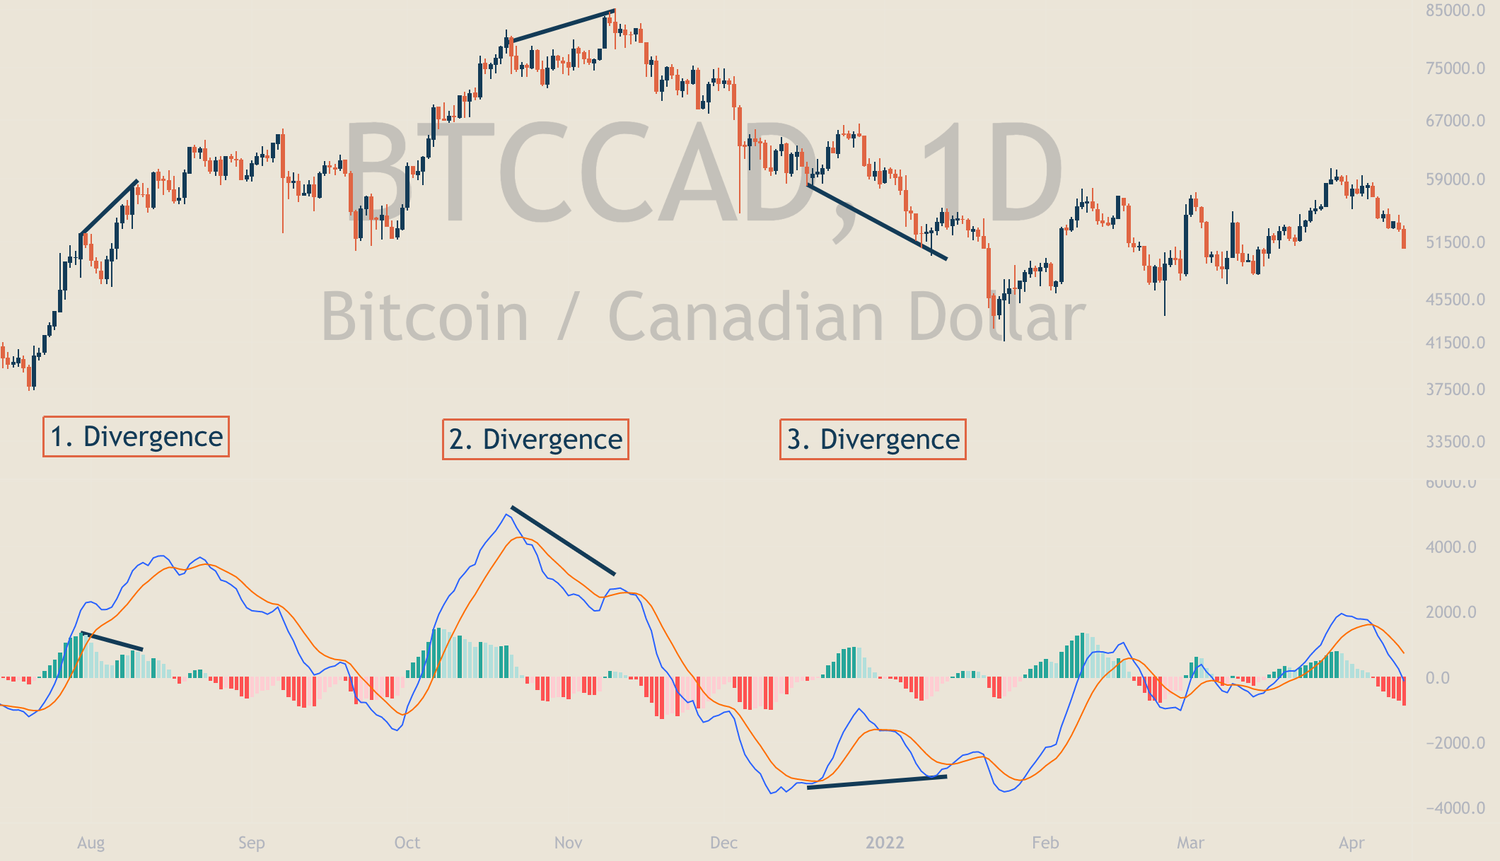
Divergence occurs when price and signal do not correlate correctly.
For example, price is making higher highs and the MACD signal line is decreasing. This divergence would be considered a bearish divergence.
Bullish divergence is when price is making a lower-lows and MACD is making a higher low.
They become significant when they are in overbought or oversold territory. Normally, this is when one may combine RSI with MACD to locate whether the asset could be in oversold or overbought territory.
Rapid Rises and Falls
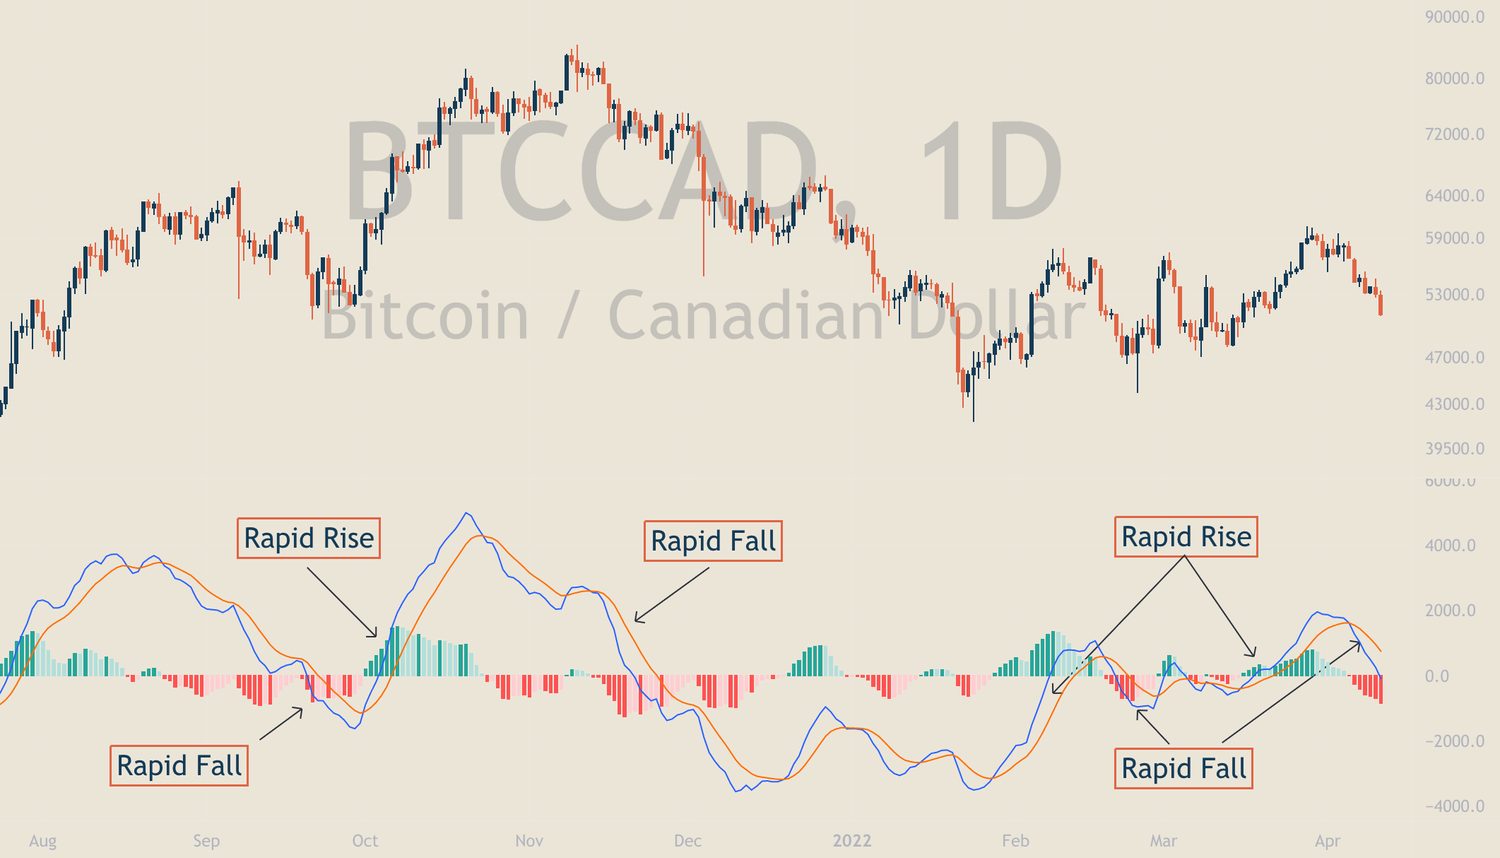
When the MACD line moves away from the signal line, it can be a signal the asset is overbought or oversold. Potentially forecasting a pullback or retest.
Problems with MACD
MACD is a lagging indicator. It uses historical price to provide fancy charts.
The signals can sometimes come late and they can generate false positives.
Please note: MACD is not the only indicator Traders use. It is normally used with other momentum indicators. Also, the belief is, Indicators are more accurate in higher time frames.
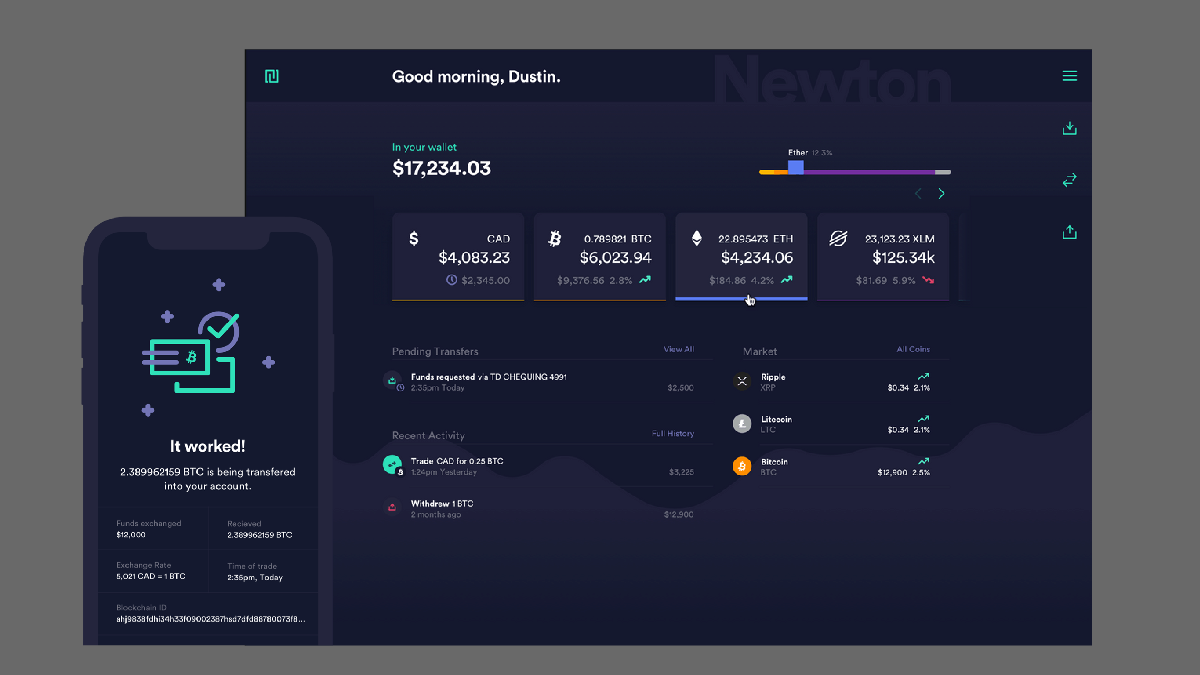
Trade on the best Canadian crypto exchange Newton!
Newton is Canada's trusted low-cost crypto trading platform.
Newton is crypto as it should be: buy and sell on any device with access to some of the best prices for cryptocurrency in Canada.
Set up and fund your account in minutes.
Newton Crypto Ltd. FINTRAC#: M19607029
Newton is Canada's trusted low-cost crypto trading platform.
Newton is crypto as it should be: buy and sell on any device with access to some of the best prices for cryptocurrency in Canada.
Set up and fund your account in minutes.
Buy & Sell in CAD
Add & withdraw funds without the headache.
Newton made it easy for you to add and remove funds. Choose between Interac® e-Transfers, wire transfers, or connect your bank account to transfer funds seamlessly.
Transfer cryptocurrency to and from your account at no additional cost (Newton will even cover the network fee up to $5 CAD).